Tongan vs American In Labor Force | Age 35-44
COMPARE
Tongan
American
In Labor Force | Age 35-44
In Labor Force | Age 35-44 Comparison
Tongans
Americans
83.6%
IN LABOR FORCE | AGE 35-44
0.4/ 100
METRIC RATING
254th/ 347
METRIC RANK
82.4%
IN LABOR FORCE | AGE 35-44
0.0/ 100
METRIC RATING
302nd/ 347
METRIC RANK
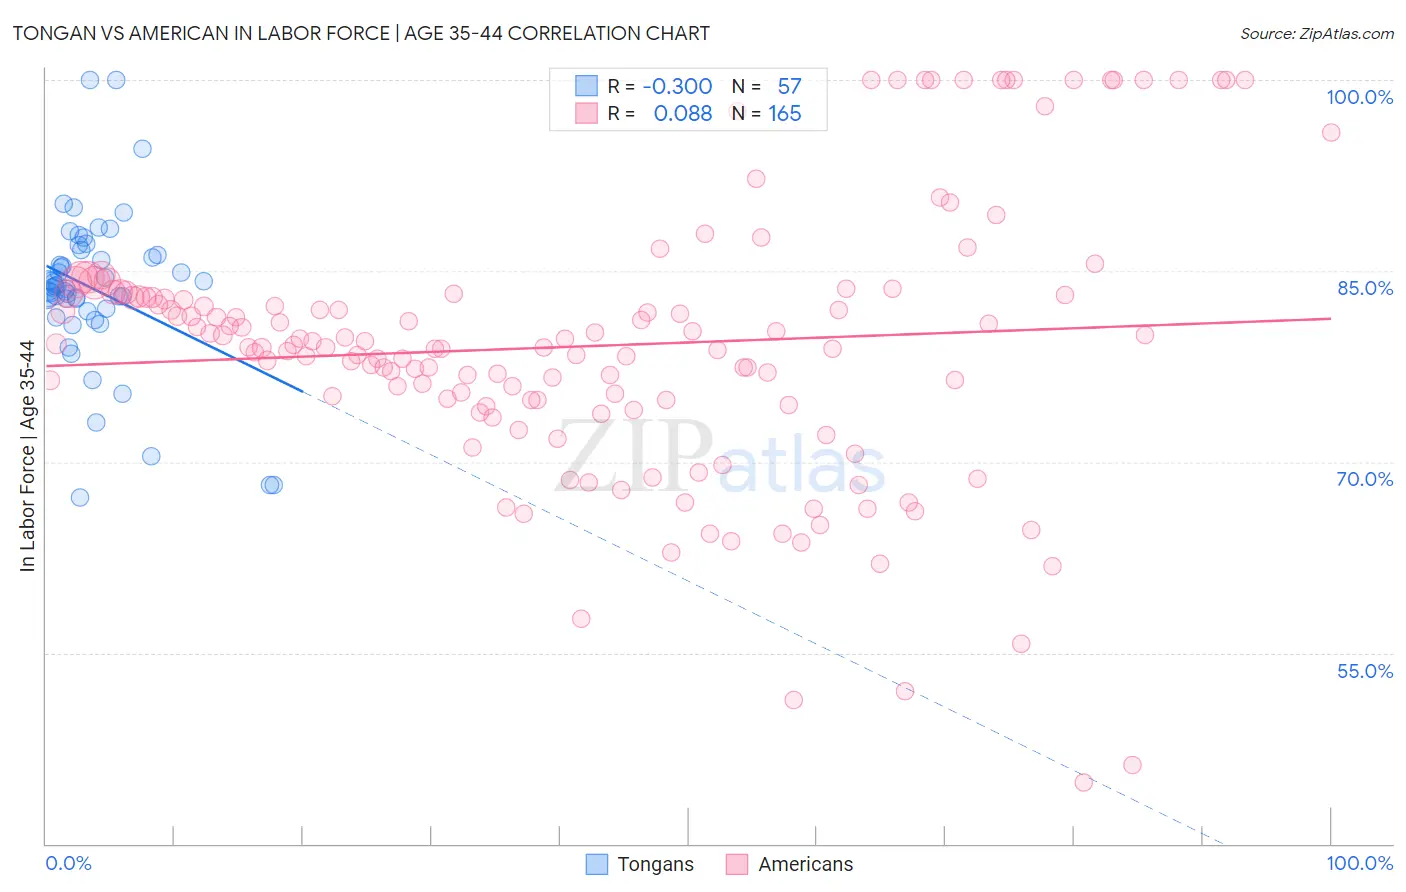
Tongan vs American In Labor Force | Age 35-44 Correlation Chart
The statistical analysis conducted on geographies consisting of 102,881,959 people shows a mild negative correlation between the proportion of Tongans and labor force participation rate among population between the ages 35 and 44 in the United States with a correlation coefficient (R) of -0.300 and weighted average of 83.6%. Similarly, the statistical analysis conducted on geographies consisting of 581,120,532 people shows a slight positive correlation between the proportion of Americans and labor force participation rate among population between the ages 35 and 44 in the United States with a correlation coefficient (R) of 0.088 and weighted average of 82.4%, a difference of 1.5%.
In Labor Force | Age 35-44 Correlation Summary
| Measurement | Tongan | American |
| Minimum | 67.2% | 44.8% |
| Maximum | 100.0% | 100.0% |
| Range | 32.8% | 55.2% |
| Mean | 83.6% | 79.1% |
| Median | 83.7% | 79.0% |
| Interquartile 25% (IQ1) | 81.9% | 74.7% |
| Interquartile 75% (IQ3) | 86.4% | 83.2% |
| Interquartile Range (IQR) | 4.6% | 8.5% |
| Standard Deviation (Sample) | 6.2% | 10.7% |
| Standard Deviation (Population) | 6.2% | 10.7% |
Similar Demographics by In Labor Force | Age 35-44
Demographics Similar to Tongans by In Labor Force | Age 35-44
In terms of in labor force | age 35-44, the demographic groups most similar to Tongans are Salvadoran (83.6%, a difference of 0.010%), Immigrants from Guyana (83.6%, a difference of 0.010%), Lebanese (83.6%, a difference of 0.010%), White/Caucasian (83.6%, a difference of 0.030%), and Immigrants from the Azores (83.6%, a difference of 0.030%).
| Demographics | Rating | Rank | In Labor Force | Age 35-44 |
| Immigrants | Armenia | 0.9 /100 | #247 | Tragic 83.7% |
| Indonesians | 0.8 /100 | #248 | Tragic 83.7% |
| Immigrants | St. Vincent and the Grenadines | 0.7 /100 | #249 | Tragic 83.7% |
| Whites/Caucasians | 0.5 /100 | #250 | Tragic 83.6% |
| Salvadorans | 0.4 /100 | #251 | Tragic 83.6% |
| Immigrants | Guyana | 0.4 /100 | #252 | Tragic 83.6% |
| Lebanese | 0.4 /100 | #253 | Tragic 83.6% |
| Tongans | 0.4 /100 | #254 | Tragic 83.6% |
| Immigrants | Azores | 0.3 /100 | #255 | Tragic 83.6% |
| Japanese | 0.3 /100 | #256 | Tragic 83.6% |
| Basques | 0.3 /100 | #257 | Tragic 83.6% |
| Tsimshian | 0.2 /100 | #258 | Tragic 83.5% |
| Immigrants | El Salvador | 0.2 /100 | #259 | Tragic 83.5% |
| Vietnamese | 0.2 /100 | #260 | Tragic 83.5% |
| Immigrants | Dominica | 0.2 /100 | #261 | Tragic 83.5% |
Demographics Similar to Americans by In Labor Force | Age 35-44
In terms of in labor force | age 35-44, the demographic groups most similar to Americans are Nepalese (82.4%, a difference of 0.0%), Marshallese (82.4%, a difference of 0.010%), Spanish American Indian (82.5%, a difference of 0.080%), Central American Indian (82.5%, a difference of 0.10%), and Tlingit-Haida (82.5%, a difference of 0.16%).
| Demographics | Rating | Rank | In Labor Force | Age 35-44 |
| Immigrants | Lebanon | 0.0 /100 | #295 | Tragic 82.7% |
| Mexican American Indians | 0.0 /100 | #296 | Tragic 82.6% |
| Hmong | 0.0 /100 | #297 | Tragic 82.6% |
| Ottawa | 0.0 /100 | #298 | Tragic 82.6% |
| Tlingit-Haida | 0.0 /100 | #299 | Tragic 82.5% |
| Central American Indians | 0.0 /100 | #300 | Tragic 82.5% |
| Spanish American Indians | 0.0 /100 | #301 | Tragic 82.5% |
| Americans | 0.0 /100 | #302 | Tragic 82.4% |
| Nepalese | 0.0 /100 | #303 | Tragic 82.4% |
| Marshallese | 0.0 /100 | #304 | Tragic 82.4% |
| Shoshone | 0.0 /100 | #305 | Tragic 82.2% |
| Blacks/African Americans | 0.0 /100 | #306 | Tragic 82.2% |
| Hispanics or Latinos | 0.0 /100 | #307 | Tragic 82.1% |
| Immigrants | Central America | 0.0 /100 | #308 | Tragic 82.0% |
| Cree | 0.0 /100 | #309 | Tragic 82.0% |