Immigrants from Micronesia vs American In Labor Force | Age 35-44
COMPARE
Immigrants from Micronesia
American
In Labor Force | Age 35-44
In Labor Force | Age 35-44 Comparison
Immigrants from Micronesia
Americans
83.1%
IN LABOR FORCE | AGE 35-44
0.0/ 100
METRIC RATING
279th/ 347
METRIC RANK
82.4%
IN LABOR FORCE | AGE 35-44
0.0/ 100
METRIC RATING
302nd/ 347
METRIC RANK
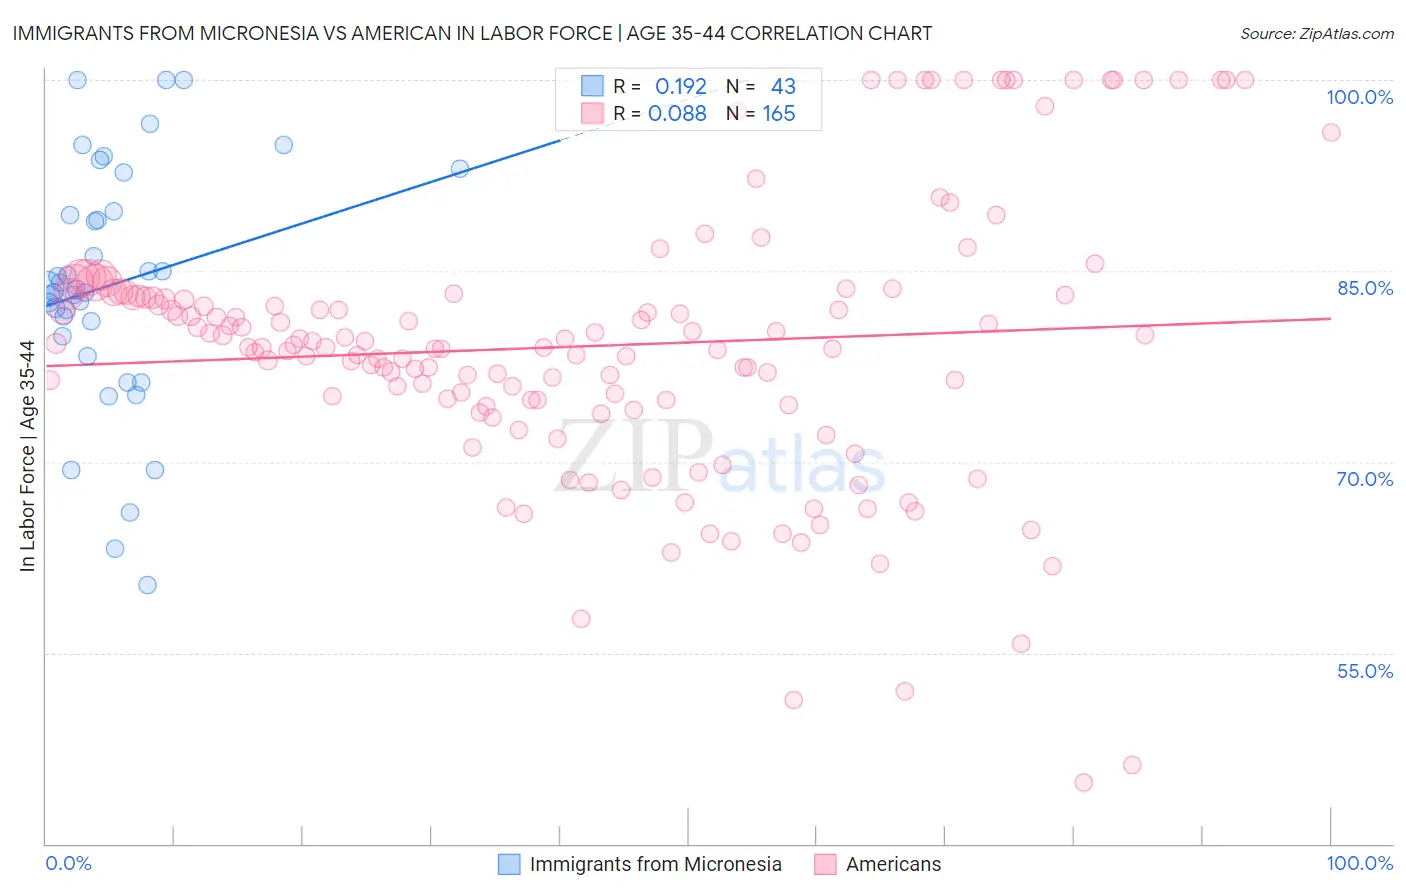
Immigrants from Micronesia vs American In Labor Force | Age 35-44 Correlation Chart
The statistical analysis conducted on geographies consisting of 61,600,178 people shows a poor positive correlation between the proportion of Immigrants from Micronesia and labor force participation rate among population between the ages 35 and 44 in the United States with a correlation coefficient (R) of 0.192 and weighted average of 83.1%. Similarly, the statistical analysis conducted on geographies consisting of 581,120,532 people shows a slight positive correlation between the proportion of Americans and labor force participation rate among population between the ages 35 and 44 in the United States with a correlation coefficient (R) of 0.088 and weighted average of 82.4%, a difference of 0.87%.
In Labor Force | Age 35-44 Correlation Summary
| Measurement | Immigrants from Micronesia | American |
| Minimum | 60.3% | 44.8% |
| Maximum | 100.0% | 100.0% |
| Range | 39.7% | 55.2% |
| Mean | 83.9% | 79.1% |
| Median | 83.6% | 79.0% |
| Interquartile 25% (IQ1) | 79.9% | 74.7% |
| Interquartile 75% (IQ3) | 89.7% | 83.2% |
| Interquartile Range (IQR) | 9.8% | 8.5% |
| Standard Deviation (Sample) | 9.4% | 10.7% |
| Standard Deviation (Population) | 9.3% | 10.7% |
Similar Demographics by In Labor Force | Age 35-44
Demographics Similar to Immigrants from Micronesia by In Labor Force | Age 35-44
In terms of in labor force | age 35-44, the demographic groups most similar to Immigrants from Micronesia are Belizean (83.1%, a difference of 0.010%), Dominican (83.1%, a difference of 0.040%), Samoan (83.2%, a difference of 0.080%), Delaware (83.2%, a difference of 0.090%), and Hawaiian (83.2%, a difference of 0.10%).
| Demographics | Rating | Rank | In Labor Force | Age 35-44 |
| Immigrants | Fiji | 0.0 /100 | #272 | Tragic 83.2% |
| Spanish | 0.0 /100 | #273 | Tragic 83.2% |
| Immigrants | Nonimmigrants | 0.0 /100 | #274 | Tragic 83.2% |
| Hawaiians | 0.0 /100 | #275 | Tragic 83.2% |
| Delaware | 0.0 /100 | #276 | Tragic 83.2% |
| Samoans | 0.0 /100 | #277 | Tragic 83.2% |
| Belizeans | 0.0 /100 | #278 | Tragic 83.1% |
| Immigrants | Micronesia | 0.0 /100 | #279 | Tragic 83.1% |
| Dominicans | 0.0 /100 | #280 | Tragic 83.1% |
| Guatemalans | 0.0 /100 | #281 | Tragic 83.0% |
| Osage | 0.0 /100 | #282 | Tragic 82.9% |
| Immigrants | Guatemala | 0.0 /100 | #283 | Tragic 82.9% |
| Immigrants | Dominican Republic | 0.0 /100 | #284 | Tragic 82.9% |
| Fijians | 0.0 /100 | #285 | Tragic 82.9% |
| Immigrants | Bangladesh | 0.0 /100 | #286 | Tragic 82.9% |
Demographics Similar to Americans by In Labor Force | Age 35-44
In terms of in labor force | age 35-44, the demographic groups most similar to Americans are Nepalese (82.4%, a difference of 0.0%), Marshallese (82.4%, a difference of 0.010%), Spanish American Indian (82.5%, a difference of 0.080%), Central American Indian (82.5%, a difference of 0.10%), and Tlingit-Haida (82.5%, a difference of 0.16%).
| Demographics | Rating | Rank | In Labor Force | Age 35-44 |
| Immigrants | Lebanon | 0.0 /100 | #295 | Tragic 82.7% |
| Mexican American Indians | 0.0 /100 | #296 | Tragic 82.6% |
| Hmong | 0.0 /100 | #297 | Tragic 82.6% |
| Ottawa | 0.0 /100 | #298 | Tragic 82.6% |
| Tlingit-Haida | 0.0 /100 | #299 | Tragic 82.5% |
| Central American Indians | 0.0 /100 | #300 | Tragic 82.5% |
| Spanish American Indians | 0.0 /100 | #301 | Tragic 82.5% |
| Americans | 0.0 /100 | #302 | Tragic 82.4% |
| Nepalese | 0.0 /100 | #303 | Tragic 82.4% |
| Marshallese | 0.0 /100 | #304 | Tragic 82.4% |
| Shoshone | 0.0 /100 | #305 | Tragic 82.2% |
| Blacks/African Americans | 0.0 /100 | #306 | Tragic 82.2% |
| Hispanics or Latinos | 0.0 /100 | #307 | Tragic 82.1% |
| Immigrants | Central America | 0.0 /100 | #308 | Tragic 82.0% |
| Cree | 0.0 /100 | #309 | Tragic 82.0% |