English vs Swiss In Labor Force | Age 20-64
COMPARE
English
Swiss
In Labor Force | Age 20-64
In Labor Force | Age 20-64 Comparison
English
Swiss
78.8%
IN LABOR FORCE | AGE 20-64
0.9/ 100
METRIC RATING
249th/ 347
METRIC RANK
79.4%
IN LABOR FORCE | AGE 20-64
28.9/ 100
METRIC RATING
191st/ 347
METRIC RANK
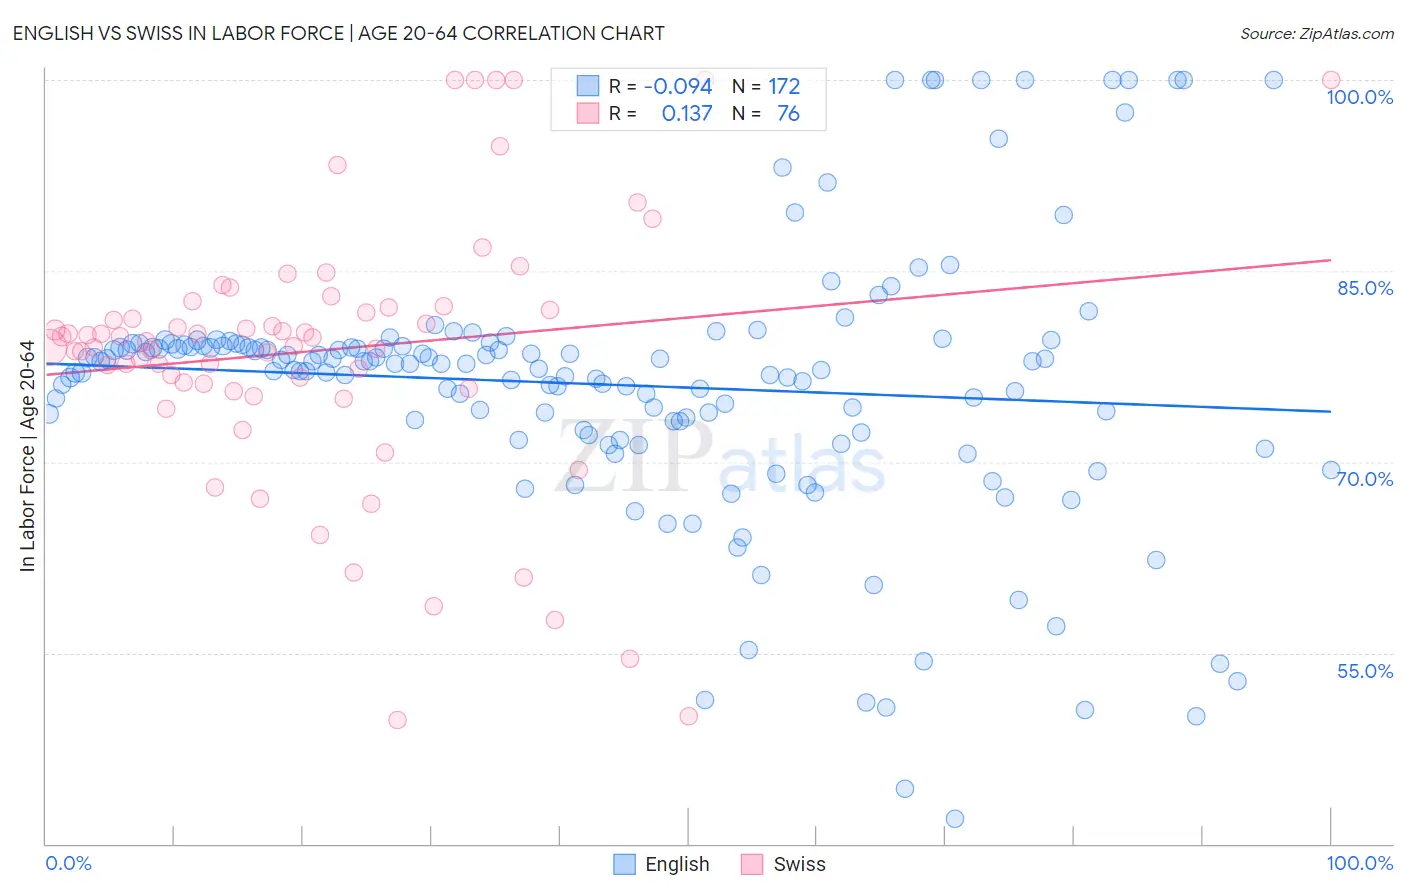
English vs Swiss In Labor Force | Age 20-64 Correlation Chart
The statistical analysis conducted on geographies consisting of 579,959,630 people shows a slight negative correlation between the proportion of English and labor force participation rate among population between the ages 20 and 64 in the United States with a correlation coefficient (R) of -0.094 and weighted average of 78.8%. Similarly, the statistical analysis conducted on geographies consisting of 465,041,286 people shows a poor positive correlation between the proportion of Swiss and labor force participation rate among population between the ages 20 and 64 in the United States with a correlation coefficient (R) of 0.137 and weighted average of 79.4%, a difference of 0.78%.
In Labor Force | Age 20-64 Correlation Summary
| Measurement | English | Swiss |
| Minimum | 42.0% | 49.7% |
| Maximum | 100.0% | 100.0% |
| Range | 58.0% | 50.3% |
| Mean | 76.1% | 78.8% |
| Median | 77.7% | 79.6% |
| Interquartile 25% (IQ1) | 72.8% | 76.0% |
| Interquartile 75% (IQ3) | 79.1% | 82.2% |
| Interquartile Range (IQR) | 6.3% | 6.2% |
| Standard Deviation (Sample) | 10.5% | 10.6% |
| Standard Deviation (Population) | 10.4% | 10.5% |
Similar Demographics by In Labor Force | Age 20-64
Demographics Similar to English by In Labor Force | Age 20-64
In terms of in labor force | age 20-64, the demographic groups most similar to English are Honduran (78.8%, a difference of 0.0%), Immigrants from Germany (78.8%, a difference of 0.030%), Immigrants from Caribbean (78.8%, a difference of 0.030%), Barbadian (78.8%, a difference of 0.030%), and Immigrants from Trinidad and Tobago (78.8%, a difference of 0.050%).
| Demographics | Rating | Rank | In Labor Force | Age 20-64 |
| Immigrants | Micronesia | 1.9 /100 | #242 | Tragic 78.9% |
| Immigrants | West Indies | 1.7 /100 | #243 | Tragic 78.9% |
| French | 1.5 /100 | #244 | Tragic 78.9% |
| Scottish | 1.3 /100 | #245 | Tragic 78.9% |
| Immigrants | Trinidad and Tobago | 1.1 /100 | #246 | Tragic 78.8% |
| Immigrants | Germany | 1.0 /100 | #247 | Tragic 78.8% |
| Immigrants | Caribbean | 1.0 /100 | #248 | Tragic 78.8% |
| English | 0.9 /100 | #249 | Tragic 78.8% |
| Hondurans | 0.8 /100 | #250 | Tragic 78.8% |
| Barbadians | 0.7 /100 | #251 | Tragic 78.8% |
| Immigrants | Honduras | 0.6 /100 | #252 | Tragic 78.7% |
| Basques | 0.5 /100 | #253 | Tragic 78.7% |
| Immigrants | Lebanon | 0.5 /100 | #254 | Tragic 78.7% |
| Hawaiians | 0.5 /100 | #255 | Tragic 78.7% |
| Celtics | 0.5 /100 | #256 | Tragic 78.7% |
Demographics Similar to Swiss by In Labor Force | Age 20-64
In terms of in labor force | age 20-64, the demographic groups most similar to Swiss are Immigrants from El Salvador (79.4%, a difference of 0.020%), Immigrants from Syria (79.4%, a difference of 0.020%), Immigrants from Denmark (79.4%, a difference of 0.020%), Immigrants from Haiti (79.4%, a difference of 0.030%), and Indonesian (79.4%, a difference of 0.030%).
| Demographics | Rating | Rank | In Labor Force | Age 20-64 |
| Finns | 35.9 /100 | #184 | Fair 79.5% |
| Israelis | 34.7 /100 | #185 | Fair 79.5% |
| Northern Europeans | 34.5 /100 | #186 | Fair 79.5% |
| Assyrians/Chaldeans/Syriacs | 33.3 /100 | #187 | Fair 79.4% |
| Immigrants | Haiti | 32.1 /100 | #188 | Fair 79.4% |
| Immigrants | El Salvador | 30.9 /100 | #189 | Fair 79.4% |
| Immigrants | Syria | 30.8 /100 | #190 | Fair 79.4% |
| Swiss | 28.9 /100 | #191 | Fair 79.4% |
| Immigrants | Denmark | 26.9 /100 | #192 | Fair 79.4% |
| Indonesians | 26.1 /100 | #193 | Fair 79.4% |
| Immigrants | Thailand | 24.8 /100 | #194 | Fair 79.4% |
| Immigrants | Austria | 23.7 /100 | #195 | Fair 79.4% |
| Ecuadorians | 23.1 /100 | #196 | Fair 79.4% |
| Immigrants | Senegal | 22.5 /100 | #197 | Fair 79.4% |
| Immigrants | Laos | 21.5 /100 | #198 | Fair 79.4% |