English vs Immigrants from Singapore In Labor Force | Age 20-64
COMPARE
English
Immigrants from Singapore
In Labor Force | Age 20-64
In Labor Force | Age 20-64 Comparison
English
Immigrants from Singapore
78.8%
IN LABOR FORCE | AGE 20-64
0.9/ 100
METRIC RATING
249th/ 347
METRIC RANK
79.9%
IN LABOR FORCE | AGE 20-64
86.7/ 100
METRIC RATING
136th/ 347
METRIC RANK
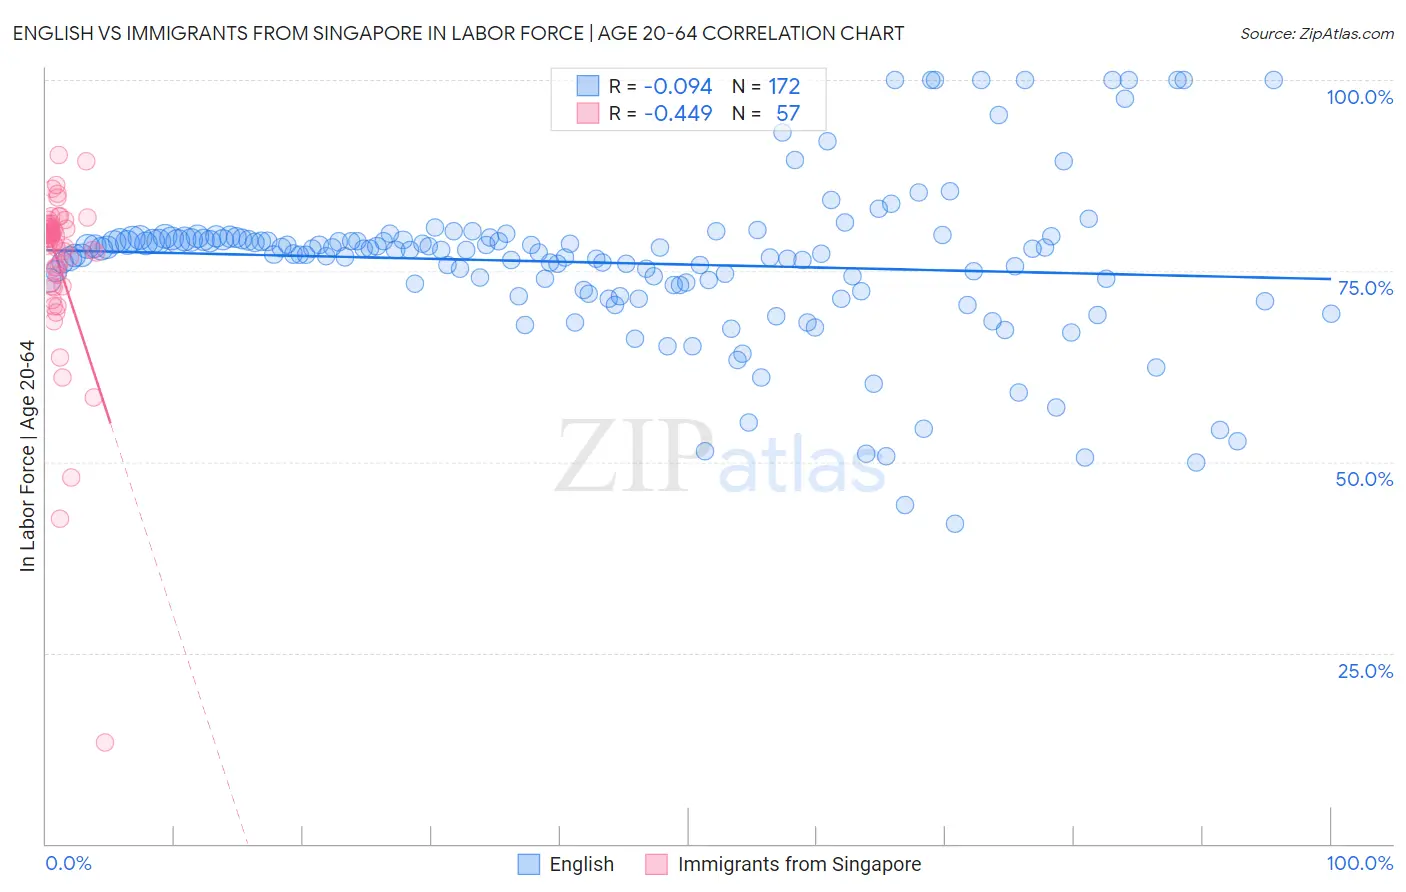
English vs Immigrants from Singapore In Labor Force | Age 20-64 Correlation Chart
The statistical analysis conducted on geographies consisting of 579,959,630 people shows a slight negative correlation between the proportion of English and labor force participation rate among population between the ages 20 and 64 in the United States with a correlation coefficient (R) of -0.094 and weighted average of 78.8%. Similarly, the statistical analysis conducted on geographies consisting of 137,521,700 people shows a moderate negative correlation between the proportion of Immigrants from Singapore and labor force participation rate among population between the ages 20 and 64 in the United States with a correlation coefficient (R) of -0.449 and weighted average of 79.9%, a difference of 1.3%.
In Labor Force | Age 20-64 Correlation Summary
| Measurement | English | Immigrants from Singapore |
| Minimum | 42.0% | 13.2% |
| Maximum | 100.0% | 90.1% |
| Range | 58.0% | 76.9% |
| Mean | 76.1% | 75.7% |
| Median | 77.7% | 79.7% |
| Interquartile 25% (IQ1) | 72.8% | 73.7% |
| Interquartile 75% (IQ3) | 79.1% | 81.0% |
| Interquartile Range (IQR) | 6.3% | 7.3% |
| Standard Deviation (Sample) | 10.5% | 12.0% |
| Standard Deviation (Population) | 10.4% | 11.9% |
Similar Demographics by In Labor Force | Age 20-64
Demographics Similar to English by In Labor Force | Age 20-64
In terms of in labor force | age 20-64, the demographic groups most similar to English are Honduran (78.8%, a difference of 0.0%), Immigrants from Germany (78.8%, a difference of 0.030%), Immigrants from Caribbean (78.8%, a difference of 0.030%), Barbadian (78.8%, a difference of 0.030%), and Immigrants from Trinidad and Tobago (78.8%, a difference of 0.050%).
| Demographics | Rating | Rank | In Labor Force | Age 20-64 |
| Immigrants | Micronesia | 1.9 /100 | #242 | Tragic 78.9% |
| Immigrants | West Indies | 1.7 /100 | #243 | Tragic 78.9% |
| French | 1.5 /100 | #244 | Tragic 78.9% |
| Scottish | 1.3 /100 | #245 | Tragic 78.9% |
| Immigrants | Trinidad and Tobago | 1.1 /100 | #246 | Tragic 78.8% |
| Immigrants | Germany | 1.0 /100 | #247 | Tragic 78.8% |
| Immigrants | Caribbean | 1.0 /100 | #248 | Tragic 78.8% |
| English | 0.9 /100 | #249 | Tragic 78.8% |
| Hondurans | 0.8 /100 | #250 | Tragic 78.8% |
| Barbadians | 0.7 /100 | #251 | Tragic 78.8% |
| Immigrants | Honduras | 0.6 /100 | #252 | Tragic 78.7% |
| Basques | 0.5 /100 | #253 | Tragic 78.7% |
| Immigrants | Lebanon | 0.5 /100 | #254 | Tragic 78.7% |
| Hawaiians | 0.5 /100 | #255 | Tragic 78.7% |
| Celtics | 0.5 /100 | #256 | Tragic 78.7% |
Demographics Similar to Immigrants from Singapore by In Labor Force | Age 20-64
In terms of in labor force | age 20-64, the demographic groups most similar to Immigrants from Singapore are Ukrainian (79.9%, a difference of 0.0%), Immigrants from Ukraine (79.9%, a difference of 0.0%), Belgian (79.9%, a difference of 0.010%), Immigrants from Nigeria (79.9%, a difference of 0.010%), and Indian (Asian) (79.9%, a difference of 0.020%).
| Demographics | Rating | Rank | In Labor Force | Age 20-64 |
| Italians | 88.9 /100 | #129 | Excellent 79.9% |
| Immigrants | Zaire | 88.6 /100 | #130 | Excellent 79.9% |
| Immigrants | Iran | 88.3 /100 | #131 | Excellent 79.9% |
| Indians (Asian) | 87.7 /100 | #132 | Excellent 79.9% |
| South American Indians | 87.6 /100 | #133 | Excellent 79.9% |
| Belgians | 87.4 /100 | #134 | Excellent 79.9% |
| Ukrainians | 86.8 /100 | #135 | Excellent 79.9% |
| Immigrants | Singapore | 86.7 /100 | #136 | Excellent 79.9% |
| Immigrants | Ukraine | 86.5 /100 | #137 | Excellent 79.9% |
| Immigrants | Nigeria | 86.4 /100 | #138 | Excellent 79.9% |
| Immigrants | Spain | 83.9 /100 | #139 | Excellent 79.8% |
| Immigrants | South Eastern Asia | 80.4 /100 | #140 | Excellent 79.8% |
| Immigrants | Israel | 80.0 /100 | #141 | Good 79.8% |
| Slovaks | 79.9 /100 | #142 | Good 79.8% |
| Immigrants | Sweden | 79.7 /100 | #143 | Good 79.8% |