Dutch West Indian vs Sri Lankan Male Unemployment
COMPARE
Dutch West Indian
Sri Lankan
Male Unemployment
Male Unemployment Comparison
Dutch West Indians
Sri Lankans
5.8%
MALE UNEMPLOYMENT
0.1/ 100
METRIC RATING
258th/ 347
METRIC RANK
5.2%
MALE UNEMPLOYMENT
77.9/ 100
METRIC RATING
144th/ 347
METRIC RANK
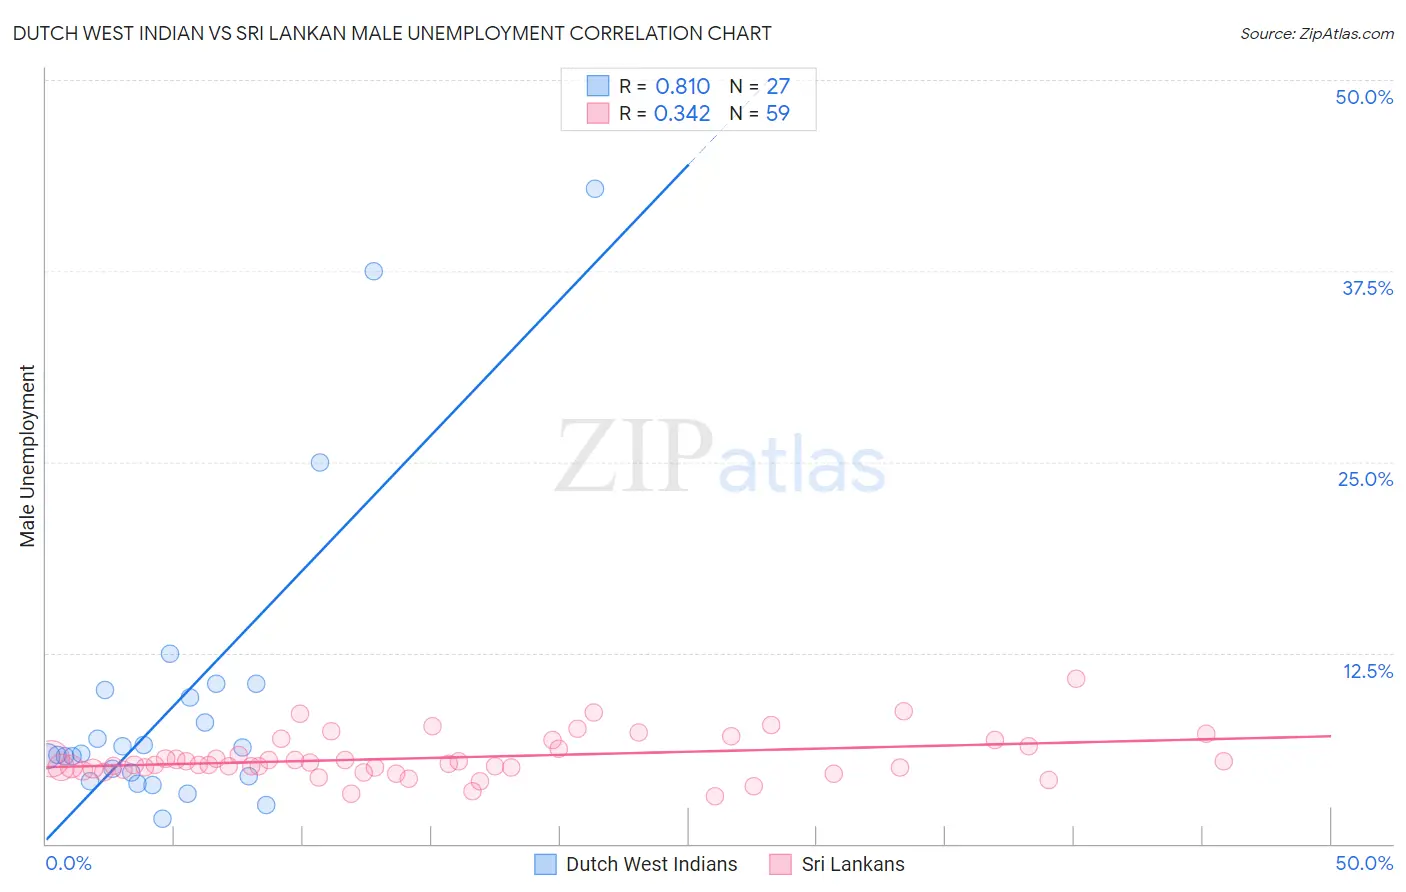
Dutch West Indian vs Sri Lankan Male Unemployment Correlation Chart
The statistical analysis conducted on geographies consisting of 85,545,191 people shows a very strong positive correlation between the proportion of Dutch West Indians and unemployment rate among males in the United States with a correlation coefficient (R) of 0.810 and weighted average of 5.8%. Similarly, the statistical analysis conducted on geographies consisting of 438,393,028 people shows a mild positive correlation between the proportion of Sri Lankans and unemployment rate among males in the United States with a correlation coefficient (R) of 0.342 and weighted average of 5.2%, a difference of 11.8%.
Male Unemployment Correlation Summary
| Measurement | Dutch West Indian | Sri Lankan |
| Minimum | 1.6% | 3.1% |
| Maximum | 42.9% | 10.8% |
| Range | 41.3% | 7.7% |
| Mean | 9.4% | 5.6% |
| Median | 5.9% | 5.2% |
| Interquartile 25% (IQ1) | 4.4% | 4.9% |
| Interquartile 75% (IQ3) | 10.1% | 6.4% |
| Interquartile Range (IQR) | 5.7% | 1.5% |
| Standard Deviation (Sample) | 9.9% | 1.4% |
| Standard Deviation (Population) | 9.8% | 1.4% |
Similar Demographics by Male Unemployment
Demographics Similar to Dutch West Indians by Male Unemployment
In terms of male unemployment, the demographic groups most similar to Dutch West Indians are Hispanic or Latino (5.8%, a difference of 0.14%), Cajun (5.8%, a difference of 0.15%), Immigrants from Central America (5.8%, a difference of 0.21%), Comanche (5.8%, a difference of 0.30%), and Kiowa (5.8%, a difference of 0.38%).
| Demographics | Rating | Rank | Male Unemployment |
| Spanish Americans | 0.3 /100 | #251 | Tragic 5.7% |
| Mexicans | 0.2 /100 | #252 | Tragic 5.8% |
| Mexican American Indians | 0.2 /100 | #253 | Tragic 5.8% |
| Japanese | 0.2 /100 | #254 | Tragic 5.8% |
| Kiowa | 0.2 /100 | #255 | Tragic 5.8% |
| Comanche | 0.2 /100 | #256 | Tragic 5.8% |
| Hispanics or Latinos | 0.1 /100 | #257 | Tragic 5.8% |
| Dutch West Indians | 0.1 /100 | #258 | Tragic 5.8% |
| Cajuns | 0.1 /100 | #259 | Tragic 5.8% |
| Immigrants | Central America | 0.1 /100 | #260 | Tragic 5.8% |
| Liberians | 0.1 /100 | #261 | Tragic 5.8% |
| Immigrants | Portugal | 0.1 /100 | #262 | Tragic 5.9% |
| Immigrants | Latin America | 0.1 /100 | #263 | Tragic 5.9% |
| Immigrants | Mexico | 0.0 /100 | #264 | Tragic 5.9% |
| French American Indians | 0.0 /100 | #265 | Tragic 5.9% |
Demographics Similar to Sri Lankans by Male Unemployment
In terms of male unemployment, the demographic groups most similar to Sri Lankans are Syrian (5.2%, a difference of 0.010%), Macedonian (5.2%, a difference of 0.010%), Immigrants from Kenya (5.2%, a difference of 0.020%), Fijian (5.2%, a difference of 0.030%), and Immigrants from Burma/Myanmar (5.2%, a difference of 0.030%).
| Demographics | Rating | Rank | Male Unemployment |
| Immigrants | Eastern Africa | 79.8 /100 | #137 | Good 5.2% |
| Immigrants | Croatia | 79.7 /100 | #138 | Good 5.2% |
| Kenyans | 79.4 /100 | #139 | Good 5.2% |
| Brazilians | 79.3 /100 | #140 | Good 5.2% |
| Immigrants | Switzerland | 79.2 /100 | #141 | Good 5.2% |
| Fijians | 78.3 /100 | #142 | Good 5.2% |
| Syrians | 78.0 /100 | #143 | Good 5.2% |
| Sri Lankans | 77.9 /100 | #144 | Good 5.2% |
| Macedonians | 77.7 /100 | #145 | Good 5.2% |
| Immigrants | Kenya | 77.6 /100 | #146 | Good 5.2% |
| Immigrants | Burma/Myanmar | 77.5 /100 | #147 | Good 5.2% |
| Immigrants | Italy | 76.3 /100 | #148 | Good 5.2% |
| Immigrants | Europe | 76.2 /100 | #149 | Good 5.2% |
| Indians (Asian) | 76.0 /100 | #150 | Good 5.2% |
| Slovaks | 75.5 /100 | #151 | Good 5.2% |