Dutch West Indian vs Immigrants from Morocco Unemployment Among Women with Children Under 6 years
COMPARE
Dutch West Indian
Immigrants from Morocco
Unemployment Among Women with Children Under 6 years
Unemployment Among Women with Children Under 6 years Comparison
Dutch West Indians
Immigrants from Morocco
9.5%
UNEMPLOYMENT AMONG WOMEN WITH CHILDREN UNDER 6 YEARS
0.0/ 100
METRIC RATING
317th/ 347
METRIC RANK
7.4%
UNEMPLOYMENT AMONG WOMEN WITH CHILDREN UNDER 6 YEARS
84.9/ 100
METRIC RATING
136th/ 347
METRIC RANK
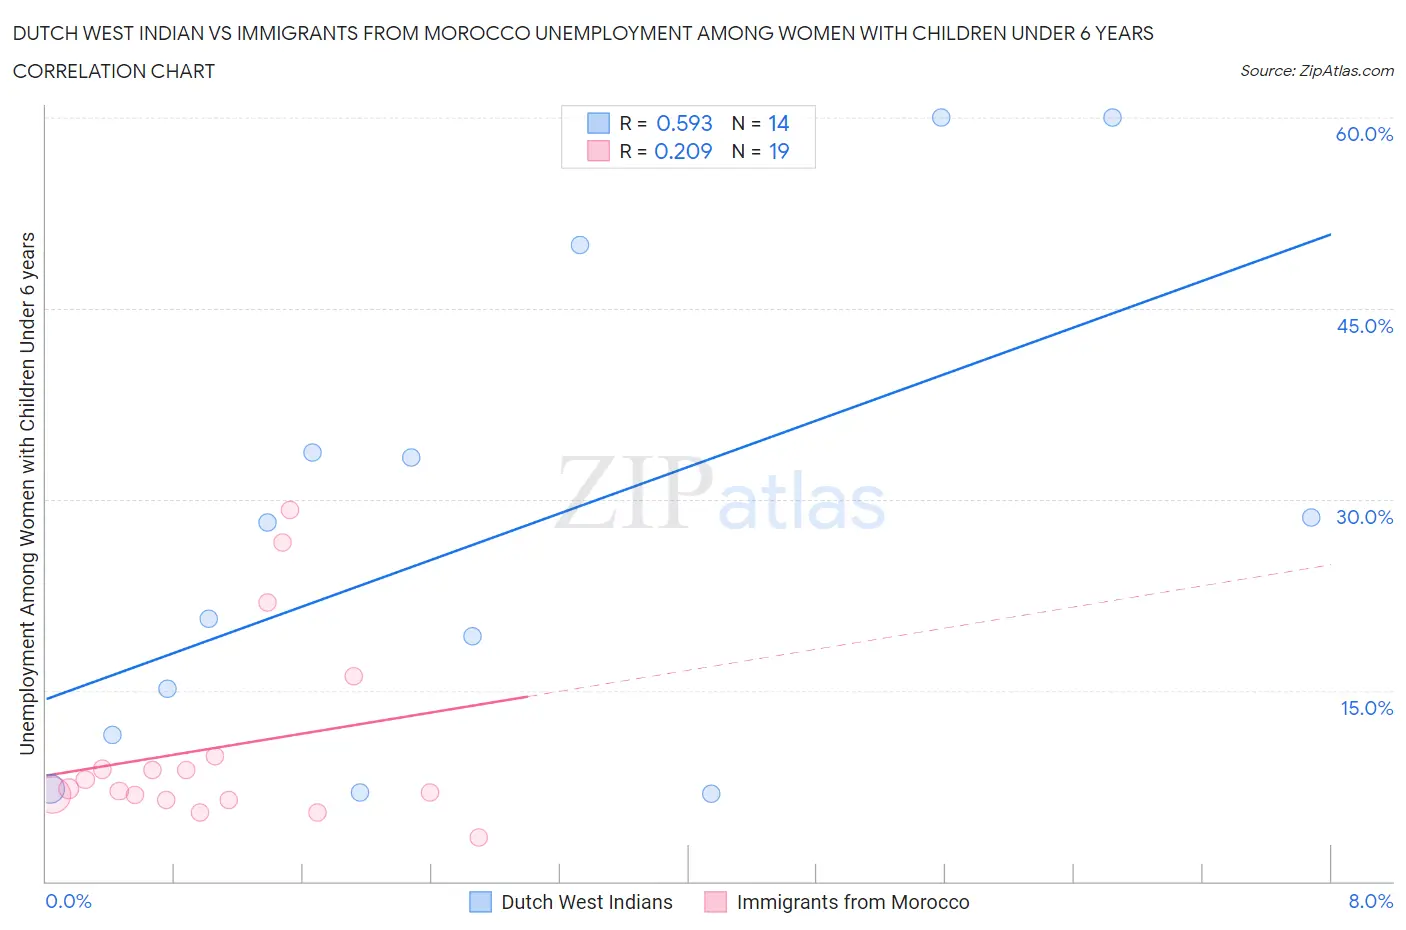
Dutch West Indian vs Immigrants from Morocco Unemployment Among Women with Children Under 6 years Correlation Chart
The statistical analysis conducted on geographies consisting of 76,130,897 people shows a substantial positive correlation between the proportion of Dutch West Indians and unemployment rate among women with children under the age of 6 in the United States with a correlation coefficient (R) of 0.593 and weighted average of 9.5%. Similarly, the statistical analysis conducted on geographies consisting of 154,831,336 people shows a weak positive correlation between the proportion of Immigrants from Morocco and unemployment rate among women with children under the age of 6 in the United States with a correlation coefficient (R) of 0.209 and weighted average of 7.4%, a difference of 27.6%.
Unemployment Among Women with Children Under 6 years Correlation Summary
| Measurement | Dutch West Indian | Immigrants from Morocco |
| Minimum | 6.9% | 3.4% |
| Maximum | 60.0% | 29.2% |
| Range | 53.1% | 25.8% |
| Mean | 27.2% | 10.5% |
| Median | 24.4% | 7.2% |
| Interquartile 25% (IQ1) | 11.5% | 6.4% |
| Interquartile 75% (IQ3) | 33.7% | 9.8% |
| Interquartile Range (IQR) | 22.2% | 3.4% |
| Standard Deviation (Sample) | 18.5% | 7.4% |
| Standard Deviation (Population) | 17.9% | 7.2% |
Similar Demographics by Unemployment Among Women with Children Under 6 years
Demographics Similar to Dutch West Indians by Unemployment Among Women with Children Under 6 years
In terms of unemployment among women with children under 6 years, the demographic groups most similar to Dutch West Indians are Osage (9.5%, a difference of 0.060%), Houma (9.4%, a difference of 0.79%), Marshallese (9.6%, a difference of 1.1%), Potawatomi (9.6%, a difference of 1.1%), and Central American Indian (9.6%, a difference of 1.2%).
| Demographics | Rating | Rank | Unemployment Among Women with Children Under 6 years |
| Cajuns | 0.0 /100 | #310 | Tragic 9.2% |
| French American Indians | 0.0 /100 | #311 | Tragic 9.2% |
| Immigrants | Azores | 0.0 /100 | #312 | Tragic 9.2% |
| Americans | 0.0 /100 | #313 | Tragic 9.3% |
| Fijians | 0.0 /100 | #314 | Tragic 9.3% |
| Cherokee | 0.0 /100 | #315 | Tragic 9.3% |
| Houma | 0.0 /100 | #316 | Tragic 9.4% |
| Dutch West Indians | 0.0 /100 | #317 | Tragic 9.5% |
| Osage | 0.0 /100 | #318 | Tragic 9.5% |
| Marshallese | 0.0 /100 | #319 | Tragic 9.6% |
| Potawatomi | 0.0 /100 | #320 | Tragic 9.6% |
| Central American Indians | 0.0 /100 | #321 | Tragic 9.6% |
| Alaska Natives | 0.0 /100 | #322 | Tragic 9.6% |
| Immigrants | Bahamas | 0.0 /100 | #323 | Tragic 9.6% |
| Paiute | 0.0 /100 | #324 | Tragic 9.7% |
Demographics Similar to Immigrants from Morocco by Unemployment Among Women with Children Under 6 years
In terms of unemployment among women with children under 6 years, the demographic groups most similar to Immigrants from Morocco are Immigrants from Cambodia (7.4%, a difference of 0.030%), Immigrants from Northern Africa (7.4%, a difference of 0.060%), Immigrants from Norway (7.4%, a difference of 0.11%), Immigrants from Bolivia (7.4%, a difference of 0.12%), and Immigrants from Colombia (7.4%, a difference of 0.13%).
| Demographics | Rating | Rank | Unemployment Among Women with Children Under 6 years |
| Slovenes | 89.2 /100 | #129 | Excellent 7.4% |
| Swedes | 88.4 /100 | #130 | Excellent 7.4% |
| Ukrainians | 88.2 /100 | #131 | Excellent 7.4% |
| Immigrants | Armenia | 87.4 /100 | #132 | Excellent 7.4% |
| Immigrants | Uganda | 86.5 /100 | #133 | Excellent 7.4% |
| Immigrants | Bolivia | 85.7 /100 | #134 | Excellent 7.4% |
| Immigrants | Northern Africa | 85.3 /100 | #135 | Excellent 7.4% |
| Immigrants | Morocco | 84.9 /100 | #136 | Excellent 7.4% |
| Immigrants | Cambodia | 84.6 /100 | #137 | Excellent 7.4% |
| Immigrants | Norway | 84.1 /100 | #138 | Excellent 7.4% |
| Immigrants | Colombia | 83.9 /100 | #139 | Excellent 7.4% |
| Scandinavians | 83.0 /100 | #140 | Excellent 7.4% |
| Greeks | 82.6 /100 | #141 | Excellent 7.4% |
| Immigrants | Argentina | 81.5 /100 | #142 | Excellent 7.5% |
| Koreans | 81.3 /100 | #143 | Excellent 7.5% |