Yuman vs Immigrants from England In Labor Force | Age 35-44
COMPARE
Yuman
Immigrants from England
In Labor Force | Age 35-44
In Labor Force | Age 35-44 Comparison
Yuman
Immigrants from England
74.7%
IN LABOR FORCE | AGE 35-44
0.0/ 100
METRIC RATING
345th/ 347
METRIC RANK
84.2%
IN LABOR FORCE | AGE 35-44
25.0/ 100
METRIC RATING
196th/ 347
METRIC RANK
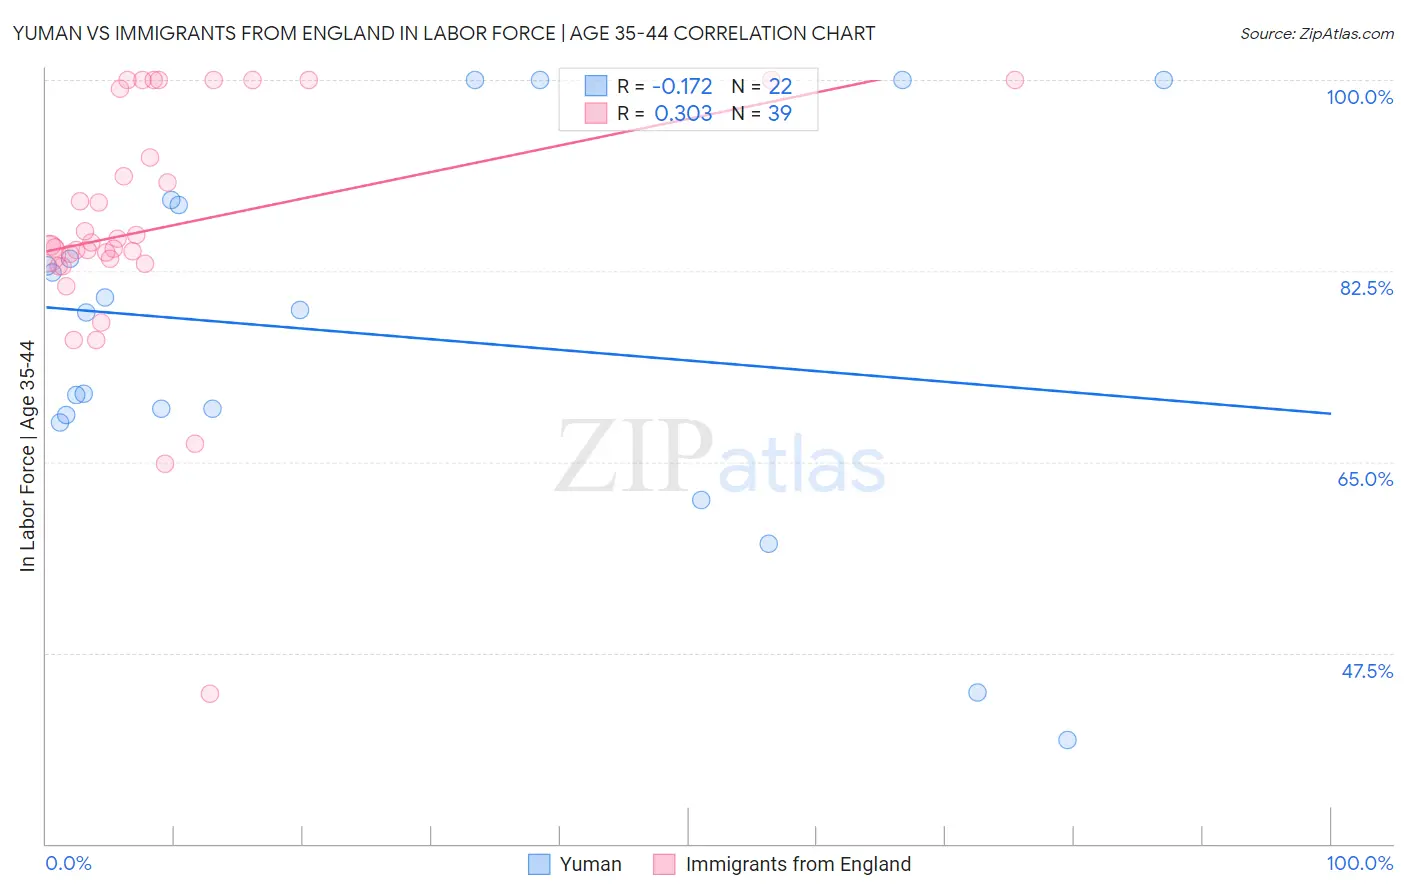
Yuman vs Immigrants from England In Labor Force | Age 35-44 Correlation Chart
The statistical analysis conducted on geographies consisting of 40,681,124 people shows a poor negative correlation between the proportion of Yuman and labor force participation rate among population between the ages 35 and 44 in the United States with a correlation coefficient (R) of -0.172 and weighted average of 74.7%. Similarly, the statistical analysis conducted on geographies consisting of 391,745,799 people shows a mild positive correlation between the proportion of Immigrants from England and labor force participation rate among population between the ages 35 and 44 in the United States with a correlation coefficient (R) of 0.303 and weighted average of 84.2%, a difference of 12.7%.
In Labor Force | Age 35-44 Correlation Summary
| Measurement | Yuman | Immigrants from England |
| Minimum | 39.5% | 43.8% |
| Maximum | 100.0% | 100.0% |
| Range | 60.5% | 56.2% |
| Mean | 76.7% | 86.5% |
| Median | 78.8% | 84.9% |
| Interquartile 25% (IQ1) | 69.3% | 83.2% |
| Interquartile 75% (IQ3) | 88.6% | 99.3% |
| Interquartile Range (IQR) | 19.3% | 16.1% |
| Standard Deviation (Sample) | 16.8% | 11.5% |
| Standard Deviation (Population) | 16.4% | 11.3% |
Similar Demographics by In Labor Force | Age 35-44
Demographics Similar to Yuman by In Labor Force | Age 35-44
In terms of in labor force | age 35-44, the demographic groups most similar to Yuman are Pima (74.8%, a difference of 0.13%), Tohono O'odham (74.1%, a difference of 0.83%), Navajo (73.8%, a difference of 1.2%), Immigrants from Yemen (76.3%, a difference of 2.1%), and Crow (76.5%, a difference of 2.3%).
| Demographics | Rating | Rank | In Labor Force | Age 35-44 |
| Kiowa | 0.0 /100 | #333 | Tragic 79.2% |
| Yakama | 0.0 /100 | #334 | Tragic 79.0% |
| Natives/Alaskans | 0.0 /100 | #335 | Tragic 78.9% |
| Arapaho | 0.0 /100 | #336 | Tragic 78.1% |
| Apache | 0.0 /100 | #337 | Tragic 77.9% |
| Pueblo | 0.0 /100 | #338 | Tragic 77.4% |
| Yup'ik | 0.0 /100 | #339 | Tragic 77.3% |
| Lumbee | 0.0 /100 | #340 | Tragic 77.0% |
| Hopi | 0.0 /100 | #341 | Tragic 77.0% |
| Crow | 0.0 /100 | #342 | Tragic 76.5% |
| Immigrants | Yemen | 0.0 /100 | #343 | Tragic 76.3% |
| Pima | 0.0 /100 | #344 | Tragic 74.8% |
| Yuman | 0.0 /100 | #345 | Tragic 74.7% |
| Tohono O'odham | 0.0 /100 | #346 | Tragic 74.1% |
| Navajo | 0.0 /100 | #347 | Tragic 73.8% |
Demographics Similar to Immigrants from England by In Labor Force | Age 35-44
In terms of in labor force | age 35-44, the demographic groups most similar to Immigrants from England are Immigrants from Western Europe (84.2%, a difference of 0.0%), Hungarian (84.2%, a difference of 0.010%), Immigrants from Indonesia (84.2%, a difference of 0.010%), Immigrants from Caribbean (84.2%, a difference of 0.010%), and Ecuadorian (84.2%, a difference of 0.010%).
| Demographics | Rating | Rank | In Labor Force | Age 35-44 |
| Immigrants | Denmark | 33.7 /100 | #189 | Fair 84.3% |
| Portuguese | 31.9 /100 | #190 | Fair 84.3% |
| Immigrants | Philippines | 27.9 /100 | #191 | Fair 84.2% |
| Immigrants | Vietnam | 27.4 /100 | #192 | Fair 84.2% |
| Hungarians | 26.8 /100 | #193 | Fair 84.2% |
| Immigrants | Indonesia | 25.7 /100 | #194 | Fair 84.2% |
| Immigrants | Caribbean | 25.7 /100 | #195 | Fair 84.2% |
| Immigrants | England | 25.0 /100 | #196 | Fair 84.2% |
| Immigrants | Western Europe | 24.7 /100 | #197 | Fair 84.2% |
| Ecuadorians | 24.0 /100 | #198 | Fair 84.2% |
| Syrians | 23.2 /100 | #199 | Fair 84.2% |
| Moroccans | 23.2 /100 | #200 | Fair 84.2% |
| British | 23.0 /100 | #201 | Fair 84.2% |
| Immigrants | Uzbekistan | 22.8 /100 | #202 | Fair 84.2% |
| Immigrants | South Eastern Asia | 22.4 /100 | #203 | Fair 84.2% |