Dominican vs Immigrants from Southern Europe In Labor Force | Age 20-64
COMPARE
Dominican
Immigrants from Southern Europe
In Labor Force | Age 20-64
In Labor Force | Age 20-64 Comparison
Dominicans
Immigrants from Southern Europe
77.7%
IN LABOR FORCE | AGE 20-64
0.0/ 100
METRIC RATING
297th/ 347
METRIC RANK
79.8%
IN LABOR FORCE | AGE 20-64
78.9/ 100
METRIC RATING
146th/ 347
METRIC RANK
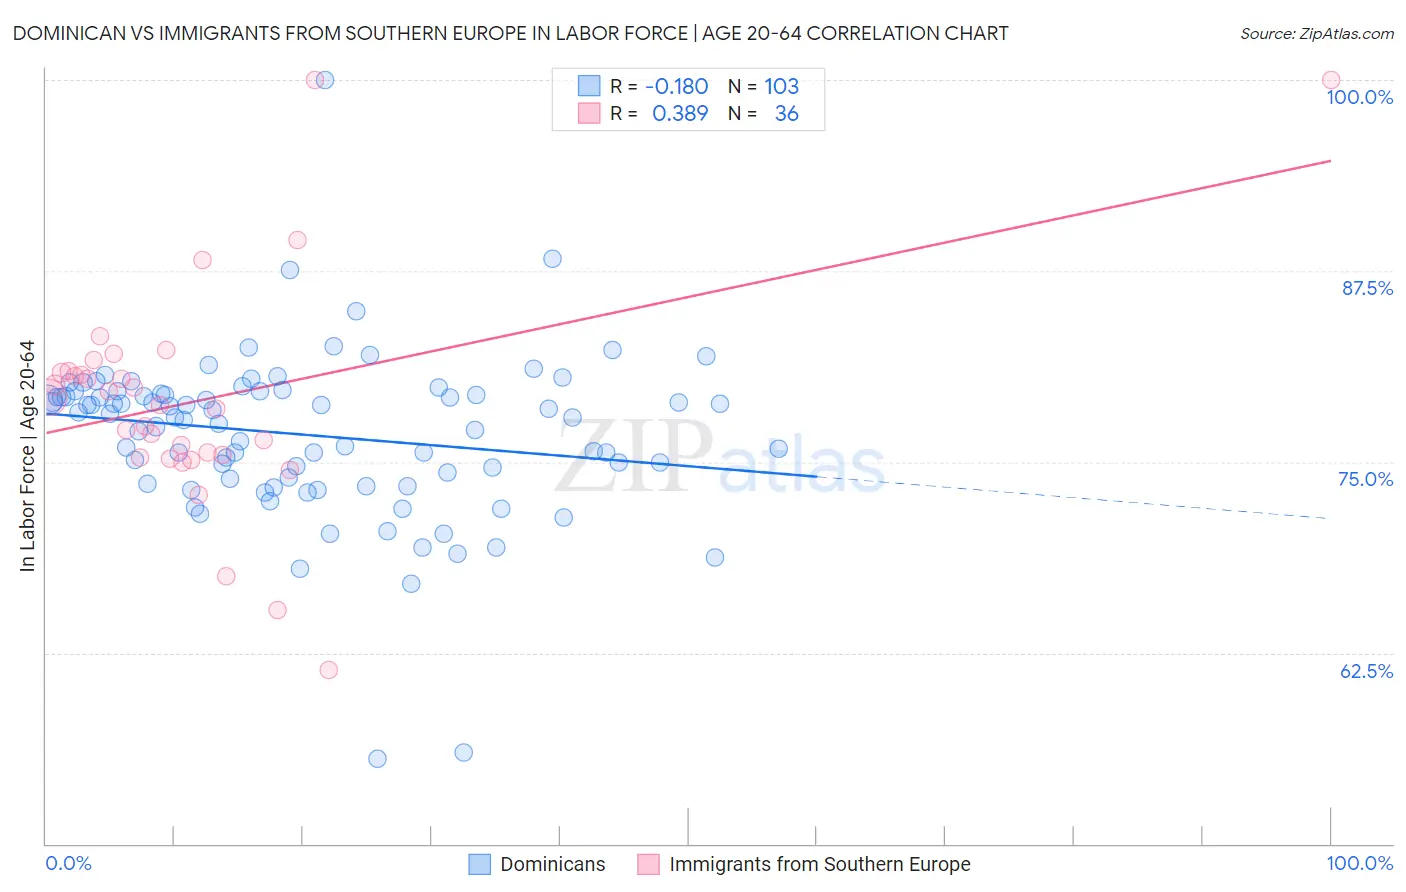
Dominican vs Immigrants from Southern Europe In Labor Force | Age 20-64 Correlation Chart
The statistical analysis conducted on geographies consisting of 355,150,221 people shows a poor negative correlation between the proportion of Dominicans and labor force participation rate among population between the ages 20 and 64 in the United States with a correlation coefficient (R) of -0.180 and weighted average of 77.7%. Similarly, the statistical analysis conducted on geographies consisting of 402,797,252 people shows a mild positive correlation between the proportion of Immigrants from Southern Europe and labor force participation rate among population between the ages 20 and 64 in the United States with a correlation coefficient (R) of 0.389 and weighted average of 79.8%, a difference of 2.7%.
In Labor Force | Age 20-64 Correlation Summary
| Measurement | Dominican | Immigrants from Southern Europe |
| Minimum | 55.6% | 61.4% |
| Maximum | 100.0% | 100.0% |
| Range | 44.4% | 38.6% |
| Mean | 76.8% | 79.0% |
| Median | 77.9% | 79.0% |
| Interquartile 25% (IQ1) | 73.9% | 75.4% |
| Interquartile 75% (IQ3) | 79.5% | 80.9% |
| Interquartile Range (IQR) | 5.6% | 5.5% |
| Standard Deviation (Sample) | 5.5% | 7.4% |
| Standard Deviation (Population) | 5.4% | 7.3% |
Similar Demographics by In Labor Force | Age 20-64
Demographics Similar to Dominicans by In Labor Force | Age 20-64
In terms of in labor force | age 20-64, the demographic groups most similar to Dominicans are Immigrants from Dominican Republic (77.7%, a difference of 0.010%), Cree (77.7%, a difference of 0.010%), Immigrants from Grenada (77.7%, a difference of 0.040%), Immigrants from Central America (77.7%, a difference of 0.070%), and Hispanic or Latino (77.6%, a difference of 0.070%).
| Demographics | Rating | Rank | In Labor Force | Age 20-64 |
| Immigrants | Bangladesh | 0.0 /100 | #290 | Tragic 77.9% |
| Spanish Americans | 0.0 /100 | #291 | Tragic 77.8% |
| Immigrants | Azores | 0.0 /100 | #292 | Tragic 77.8% |
| Delaware | 0.0 /100 | #293 | Tragic 77.8% |
| Immigrants | Central America | 0.0 /100 | #294 | Tragic 77.7% |
| Immigrants | Grenada | 0.0 /100 | #295 | Tragic 77.7% |
| Immigrants | Dominican Republic | 0.0 /100 | #296 | Tragic 77.7% |
| Dominicans | 0.0 /100 | #297 | Tragic 77.7% |
| Cree | 0.0 /100 | #298 | Tragic 77.7% |
| Hispanics or Latinos | 0.0 /100 | #299 | Tragic 77.6% |
| Spanish American Indians | 0.0 /100 | #300 | Tragic 77.6% |
| Nepalese | 0.0 /100 | #301 | Tragic 77.5% |
| Iroquois | 0.0 /100 | #302 | Tragic 77.5% |
| Chippewa | 0.0 /100 | #303 | Tragic 77.3% |
| Immigrants | Mexico | 0.0 /100 | #304 | Tragic 77.3% |
Demographics Similar to Immigrants from Southern Europe by In Labor Force | Age 20-64
In terms of in labor force | age 20-64, the demographic groups most similar to Immigrants from Southern Europe are Pakistani (79.8%, a difference of 0.0%), Immigrants from Israel (79.8%, a difference of 0.010%), Slovak (79.8%, a difference of 0.010%), Immigrants from Sweden (79.8%, a difference of 0.010%), and Korean (79.8%, a difference of 0.010%).
| Demographics | Rating | Rank | In Labor Force | Age 20-64 |
| Immigrants | Spain | 83.9 /100 | #139 | Excellent 79.8% |
| Immigrants | South Eastern Asia | 80.4 /100 | #140 | Excellent 79.8% |
| Immigrants | Israel | 80.0 /100 | #141 | Good 79.8% |
| Slovaks | 79.9 /100 | #142 | Good 79.8% |
| Immigrants | Sweden | 79.7 /100 | #143 | Good 79.8% |
| Koreans | 79.6 /100 | #144 | Good 79.8% |
| Pakistanis | 79.3 /100 | #145 | Good 79.8% |
| Immigrants | Southern Europe | 78.9 /100 | #146 | Good 79.8% |
| Immigrants | Philippines | 78.0 /100 | #147 | Good 79.8% |
| Romanians | 77.6 /100 | #148 | Good 79.8% |
| Icelanders | 75.1 /100 | #149 | Good 79.7% |
| Costa Ricans | 72.4 /100 | #150 | Good 79.7% |
| Scandinavians | 72.0 /100 | #151 | Good 79.7% |
| Immigrants | Northern Europe | 72.0 /100 | #152 | Good 79.7% |
| Immigrants | Kazakhstan | 69.5 /100 | #153 | Good 79.7% |