Irish vs Immigrants from Burma/Myanmar In Labor Force | Age 20-64
COMPARE
Irish
Immigrants from Burma/Myanmar
In Labor Force | Age 20-64
In Labor Force | Age 20-64 Comparison
Irish
Immigrants from Burma/Myanmar
79.3%
IN LABOR FORCE | AGE 20-64
13.2/ 100
METRIC RATING
212th/ 347
METRIC RANK
79.7%
IN LABOR FORCE | AGE 20-64
64.4/ 100
METRIC RATING
164th/ 347
METRIC RANK
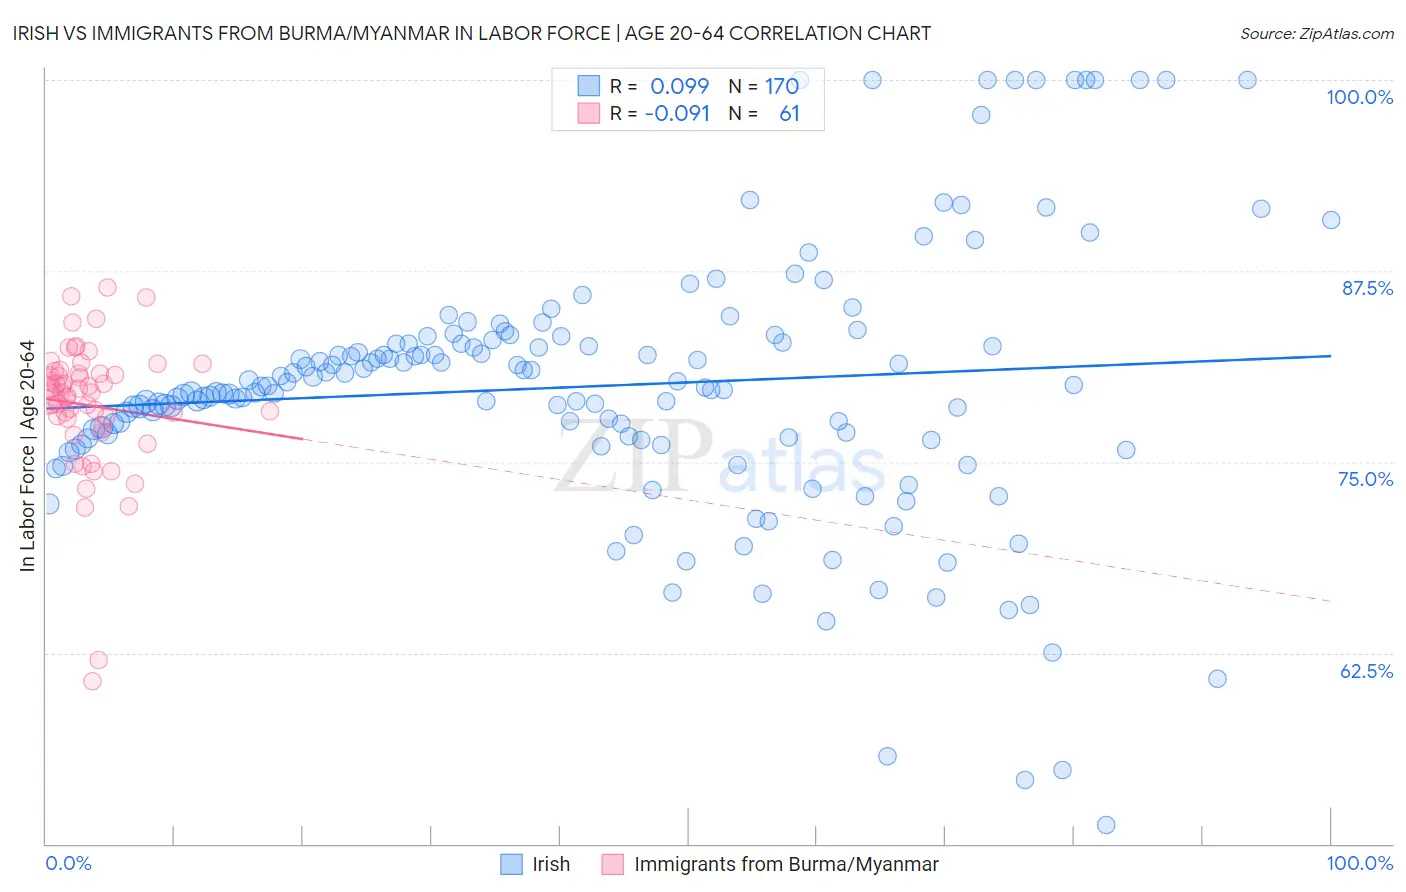
Irish vs Immigrants from Burma/Myanmar In Labor Force | Age 20-64 Correlation Chart
The statistical analysis conducted on geographies consisting of 580,689,060 people shows a slight positive correlation between the proportion of Irish and labor force participation rate among population between the ages 20 and 64 in the United States with a correlation coefficient (R) of 0.099 and weighted average of 79.3%. Similarly, the statistical analysis conducted on geographies consisting of 172,360,396 people shows a slight negative correlation between the proportion of Immigrants from Burma/Myanmar and labor force participation rate among population between the ages 20 and 64 in the United States with a correlation coefficient (R) of -0.091 and weighted average of 79.7%, a difference of 0.50%.
In Labor Force | Age 20-64 Correlation Summary
| Measurement | Irish | Immigrants from Burma/Myanmar |
| Minimum | 51.2% | 60.6% |
| Maximum | 100.0% | 86.4% |
| Range | 48.8% | 25.8% |
| Mean | 80.0% | 78.7% |
| Median | 79.9% | 79.5% |
| Interquartile 25% (IQ1) | 76.5% | 77.6% |
| Interquartile 75% (IQ3) | 82.8% | 80.9% |
| Interquartile Range (IQR) | 6.3% | 3.3% |
| Standard Deviation (Sample) | 8.8% | 4.5% |
| Standard Deviation (Population) | 8.8% | 4.5% |
Similar Demographics by In Labor Force | Age 20-64
Demographics Similar to Irish by In Labor Force | Age 20-64
In terms of in labor force | age 20-64, the demographic groups most similar to Irish are Immigrants from Portugal (79.3%, a difference of 0.010%), Immigrants from Armenia (79.2%, a difference of 0.020%), Immigrants from Norway (79.2%, a difference of 0.020%), Arab (79.2%, a difference of 0.030%), and European (79.3%, a difference of 0.040%).
| Demographics | Rating | Rank | In Labor Force | Age 20-64 |
| Immigrants | Congo | 17.5 /100 | #205 | Poor 79.3% |
| Immigrants | Ecuador | 16.9 /100 | #206 | Poor 79.3% |
| Sub-Saharan Africans | 16.5 /100 | #207 | Poor 79.3% |
| British | 16.5 /100 | #208 | Poor 79.3% |
| Bangladeshis | 16.4 /100 | #209 | Poor 79.3% |
| Haitians | 16.1 /100 | #210 | Poor 79.3% |
| Europeans | 15.3 /100 | #211 | Poor 79.3% |
| Irish | 13.2 /100 | #212 | Poor 79.3% |
| Immigrants | Portugal | 12.8 /100 | #213 | Poor 79.3% |
| Immigrants | Armenia | 12.2 /100 | #214 | Poor 79.2% |
| Immigrants | Norway | 12.0 /100 | #215 | Poor 79.2% |
| Arabs | 11.4 /100 | #216 | Poor 79.2% |
| Immigrants | Western Asia | 11.0 /100 | #217 | Poor 79.2% |
| Immigrants | England | 9.3 /100 | #218 | Tragic 79.2% |
| French Canadians | 8.4 /100 | #219 | Tragic 79.2% |
Demographics Similar to Immigrants from Burma/Myanmar by In Labor Force | Age 20-64
In terms of in labor force | age 20-64, the demographic groups most similar to Immigrants from Burma/Myanmar are Immigrants from Costa Rica (79.7%, a difference of 0.0%), Nigerian (79.7%, a difference of 0.0%), German (79.7%, a difference of 0.010%), Okinawan (79.6%, a difference of 0.010%), and Immigrants from Cuba (79.7%, a difference of 0.020%).
| Demographics | Rating | Rank | In Labor Force | Age 20-64 |
| Immigrants | China | 69.1 /100 | #157 | Good 79.7% |
| Austrians | 67.6 /100 | #158 | Good 79.7% |
| Immigrants | Cuba | 66.7 /100 | #159 | Good 79.7% |
| Moroccans | 66.7 /100 | #160 | Good 79.7% |
| South Africans | 66.2 /100 | #161 | Good 79.7% |
| Germans | 65.2 /100 | #162 | Good 79.7% |
| Immigrants | Costa Rica | 64.6 /100 | #163 | Good 79.7% |
| Immigrants | Burma/Myanmar | 64.4 /100 | #164 | Good 79.7% |
| Nigerians | 64.0 /100 | #165 | Good 79.7% |
| Okinawans | 62.7 /100 | #166 | Good 79.6% |
| Immigrants | Iraq | 62.0 /100 | #167 | Good 79.6% |
| Immigrants | Indonesia | 61.8 /100 | #168 | Good 79.6% |
| Laotians | 58.4 /100 | #169 | Average 79.6% |
| Slavs | 54.0 /100 | #170 | Average 79.6% |
| Immigrants | Switzerland | 53.3 /100 | #171 | Average 79.6% |