Sioux vs Albanian In Labor Force | Age 45-54
COMPARE
Sioux
Albanian
In Labor Force | Age 45-54
In Labor Force | Age 45-54 Comparison
Sioux
Albanians
78.0%
IN LABOR FORCE | AGE 45-54
0.0/ 100
METRIC RATING
328th/ 347
METRIC RANK
83.3%
IN LABOR FORCE | AGE 45-54
93.9/ 100
METRIC RATING
103rd/ 347
METRIC RANK
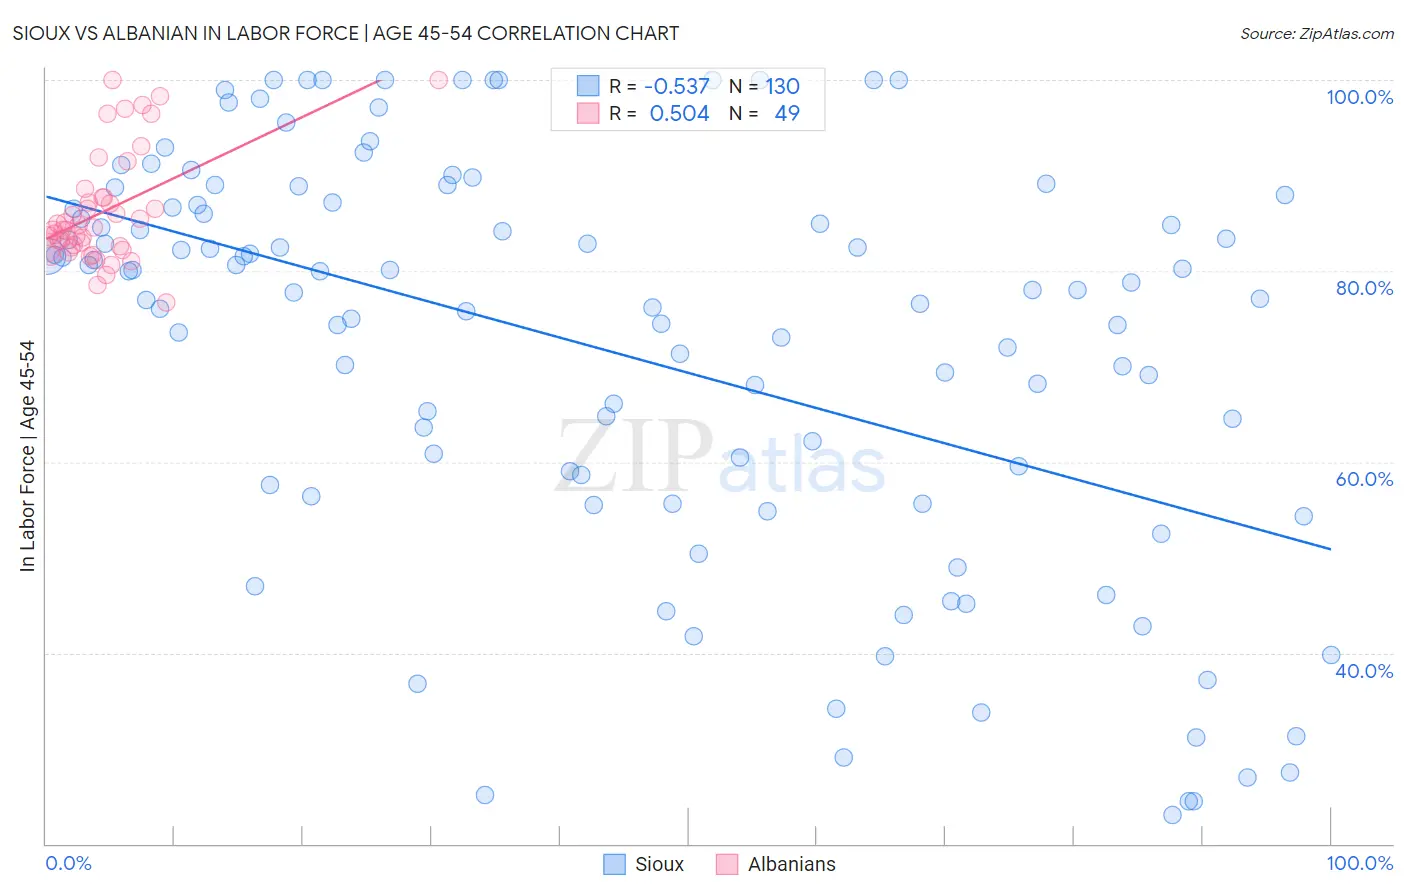
Sioux vs Albanian In Labor Force | Age 45-54 Correlation Chart
The statistical analysis conducted on geographies consisting of 234,094,321 people shows a substantial negative correlation between the proportion of Sioux and labor force participation rate among population between the ages 45 and 54 in the United States with a correlation coefficient (R) of -0.537 and weighted average of 78.0%. Similarly, the statistical analysis conducted on geographies consisting of 193,191,598 people shows a substantial positive correlation between the proportion of Albanians and labor force participation rate among population between the ages 45 and 54 in the United States with a correlation coefficient (R) of 0.504 and weighted average of 83.3%, a difference of 6.8%.
In Labor Force | Age 45-54 Correlation Summary
| Measurement | Sioux | Albanian |
| Minimum | 23.0% | 76.7% |
| Maximum | 100.0% | 100.0% |
| Range | 77.0% | 23.3% |
| Mean | 71.7% | 86.2% |
| Median | 77.9% | 84.3% |
| Interquartile 25% (IQ1) | 57.6% | 82.5% |
| Interquartile 75% (IQ3) | 86.6% | 87.7% |
| Interquartile Range (IQR) | 29.0% | 5.2% |
| Standard Deviation (Sample) | 21.0% | 5.8% |
| Standard Deviation (Population) | 21.0% | 5.7% |
Similar Demographics by In Labor Force | Age 45-54
Demographics Similar to Sioux by In Labor Force | Age 45-54
In terms of in labor force | age 45-54, the demographic groups most similar to Sioux are Cajun (78.1%, a difference of 0.22%), Seminole (78.1%, a difference of 0.23%), Choctaw (78.2%, a difference of 0.28%), Creek (77.7%, a difference of 0.29%), and Dutch West Indian (78.2%, a difference of 0.37%).
| Demographics | Rating | Rank | In Labor Force | Age 45-54 |
| Yup'ik | 0.0 /100 | #321 | Tragic 78.6% |
| Crow | 0.0 /100 | #322 | Tragic 78.3% |
| Kiowa | 0.0 /100 | #323 | Tragic 78.3% |
| Dutch West Indians | 0.0 /100 | #324 | Tragic 78.2% |
| Choctaw | 0.0 /100 | #325 | Tragic 78.2% |
| Seminole | 0.0 /100 | #326 | Tragic 78.1% |
| Cajuns | 0.0 /100 | #327 | Tragic 78.1% |
| Sioux | 0.0 /100 | #328 | Tragic 78.0% |
| Creek | 0.0 /100 | #329 | Tragic 77.7% |
| Cheyenne | 0.0 /100 | #330 | Tragic 77.6% |
| Tsimshian | 0.0 /100 | #331 | Tragic 77.4% |
| Menominee | 0.0 /100 | #332 | Tragic 77.4% |
| Natives/Alaskans | 0.0 /100 | #333 | Tragic 77.1% |
| Apache | 0.0 /100 | #334 | Tragic 77.1% |
| Arapaho | 0.0 /100 | #335 | Tragic 77.1% |
Demographics Similar to Albanians by In Labor Force | Age 45-54
In terms of in labor force | age 45-54, the demographic groups most similar to Albanians are Immigrants from Singapore (83.3%, a difference of 0.0%), Immigrants from Romania (83.3%, a difference of 0.0%), Immigrants from Middle Africa (83.3%, a difference of 0.010%), Mongolian (83.3%, a difference of 0.010%), and Immigrants from Belarus (83.3%, a difference of 0.010%).
| Demographics | Rating | Rank | In Labor Force | Age 45-54 |
| Immigrants | Kuwait | 94.8 /100 | #96 | Exceptional 83.3% |
| Palestinians | 94.8 /100 | #97 | Exceptional 83.3% |
| Maltese | 94.4 /100 | #98 | Exceptional 83.3% |
| Immigrants | Middle Africa | 94.3 /100 | #99 | Exceptional 83.3% |
| Mongolians | 94.2 /100 | #100 | Exceptional 83.3% |
| Immigrants | Belarus | 94.1 /100 | #101 | Exceptional 83.3% |
| Immigrants | Singapore | 93.9 /100 | #102 | Exceptional 83.3% |
| Albanians | 93.9 /100 | #103 | Exceptional 83.3% |
| Immigrants | Romania | 93.8 /100 | #104 | Exceptional 83.3% |
| Immigrants | South America | 93.5 /100 | #105 | Exceptional 83.2% |
| Sri Lankans | 93.2 /100 | #106 | Exceptional 83.2% |
| Iranians | 92.9 /100 | #107 | Exceptional 83.2% |
| Slovaks | 92.8 /100 | #108 | Exceptional 83.2% |
| Ukrainians | 92.7 /100 | #109 | Exceptional 83.2% |
| Immigrants | Africa | 92.6 /100 | #110 | Exceptional 83.2% |