Liberian vs Albanian In Labor Force | Age 45-54
COMPARE
Liberian
Albanian
In Labor Force | Age 45-54
In Labor Force | Age 45-54 Comparison
Liberians
Albanians
83.0%
IN LABOR FORCE | AGE 45-54
82.7/ 100
METRIC RATING
133rd/ 347
METRIC RANK
83.3%
IN LABOR FORCE | AGE 45-54
93.9/ 100
METRIC RATING
103rd/ 347
METRIC RANK
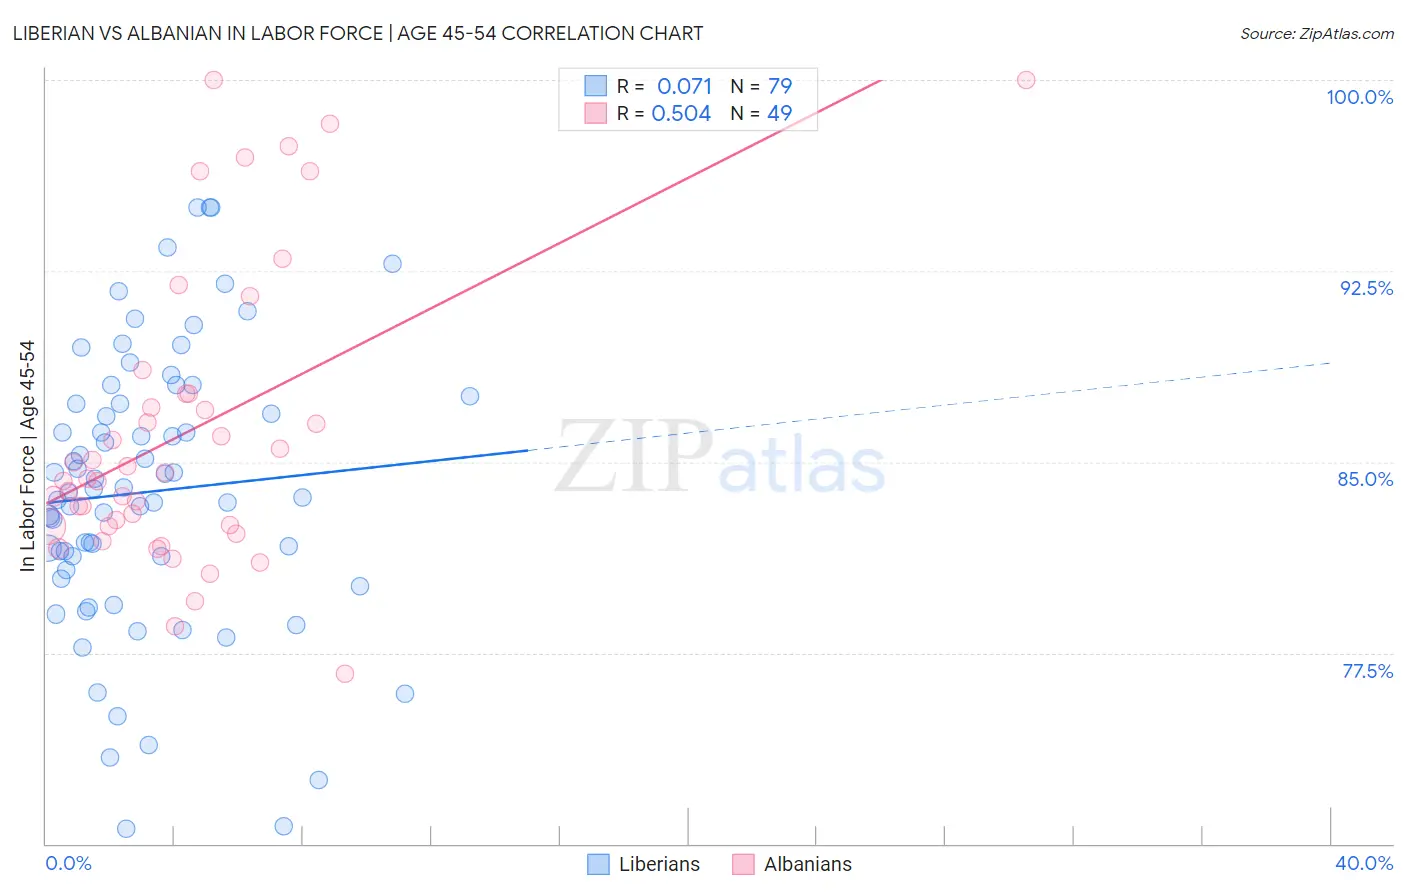
Liberian vs Albanian In Labor Force | Age 45-54 Correlation Chart
The statistical analysis conducted on geographies consisting of 118,034,202 people shows a slight positive correlation between the proportion of Liberians and labor force participation rate among population between the ages 45 and 54 in the United States with a correlation coefficient (R) of 0.071 and weighted average of 83.0%. Similarly, the statistical analysis conducted on geographies consisting of 193,191,598 people shows a substantial positive correlation between the proportion of Albanians and labor force participation rate among population between the ages 45 and 54 in the United States with a correlation coefficient (R) of 0.504 and weighted average of 83.3%, a difference of 0.26%.
In Labor Force | Age 45-54 Correlation Summary
| Measurement | Liberian | Albanian |
| Minimum | 70.6% | 76.7% |
| Maximum | 95.0% | 100.0% |
| Range | 24.4% | 23.3% |
| Mean | 83.8% | 86.2% |
| Median | 83.8% | 84.3% |
| Interquartile 25% (IQ1) | 80.7% | 82.5% |
| Interquartile 75% (IQ3) | 87.3% | 87.7% |
| Interquartile Range (IQR) | 6.6% | 5.2% |
| Standard Deviation (Sample) | 5.5% | 5.8% |
| Standard Deviation (Population) | 5.4% | 5.7% |
Similar Demographics by In Labor Force | Age 45-54
Demographics Similar to Liberians by In Labor Force | Age 45-54
In terms of in labor force | age 45-54, the demographic groups most similar to Liberians are Immigrants from Ukraine (83.0%, a difference of 0.0%), Finnish (83.1%, a difference of 0.010%), Sudanese (83.0%, a difference of 0.010%), Austrian (83.0%, a difference of 0.020%), and Immigrants from Israel (83.1%, a difference of 0.030%).
| Demographics | Rating | Rank | In Labor Force | Age 45-54 |
| Immigrants | Belgium | 86.4 /100 | #126 | Excellent 83.1% |
| Immigrants | Jordan | 85.2 /100 | #127 | Excellent 83.1% |
| Germans | 85.1 /100 | #128 | Excellent 83.1% |
| Immigrants | Northern Europe | 85.1 /100 | #129 | Excellent 83.1% |
| Immigrants | Israel | 84.7 /100 | #130 | Excellent 83.1% |
| Finns | 83.3 /100 | #131 | Excellent 83.1% |
| Immigrants | Ukraine | 82.9 /100 | #132 | Excellent 83.0% |
| Liberians | 82.7 /100 | #133 | Excellent 83.0% |
| Sudanese | 82.0 /100 | #134 | Excellent 83.0% |
| Austrians | 81.3 /100 | #135 | Excellent 83.0% |
| Immigrants | Kazakhstan | 81.0 /100 | #136 | Excellent 83.0% |
| Immigrants | Spain | 80.4 /100 | #137 | Excellent 83.0% |
| Ghanaians | 79.5 /100 | #138 | Good 83.0% |
| Scandinavians | 78.5 /100 | #139 | Good 83.0% |
| Yugoslavians | 78.3 /100 | #140 | Good 83.0% |
Demographics Similar to Albanians by In Labor Force | Age 45-54
In terms of in labor force | age 45-54, the demographic groups most similar to Albanians are Immigrants from Singapore (83.3%, a difference of 0.0%), Immigrants from Romania (83.3%, a difference of 0.0%), Immigrants from Middle Africa (83.3%, a difference of 0.010%), Mongolian (83.3%, a difference of 0.010%), and Immigrants from Belarus (83.3%, a difference of 0.010%).
| Demographics | Rating | Rank | In Labor Force | Age 45-54 |
| Immigrants | Kuwait | 94.8 /100 | #96 | Exceptional 83.3% |
| Palestinians | 94.8 /100 | #97 | Exceptional 83.3% |
| Maltese | 94.4 /100 | #98 | Exceptional 83.3% |
| Immigrants | Middle Africa | 94.3 /100 | #99 | Exceptional 83.3% |
| Mongolians | 94.2 /100 | #100 | Exceptional 83.3% |
| Immigrants | Belarus | 94.1 /100 | #101 | Exceptional 83.3% |
| Immigrants | Singapore | 93.9 /100 | #102 | Exceptional 83.3% |
| Albanians | 93.9 /100 | #103 | Exceptional 83.3% |
| Immigrants | Romania | 93.8 /100 | #104 | Exceptional 83.3% |
| Immigrants | South America | 93.5 /100 | #105 | Exceptional 83.2% |
| Sri Lankans | 93.2 /100 | #106 | Exceptional 83.2% |
| Iranians | 92.9 /100 | #107 | Exceptional 83.2% |
| Slovaks | 92.8 /100 | #108 | Exceptional 83.2% |
| Ukrainians | 92.7 /100 | #109 | Exceptional 83.2% |
| Immigrants | Africa | 92.6 /100 | #110 | Exceptional 83.2% |