Delaware vs Albanian In Labor Force | Age 20-24
COMPARE
Delaware
Albanian
In Labor Force | Age 20-24
In Labor Force | Age 20-24 Comparison
Delaware
Albanians
75.5%
IN LABOR FORCE | AGE 20-24
84.5/ 100
METRIC RATING
140th/ 347
METRIC RANK
74.6%
IN LABOR FORCE | AGE 20-24
16.2/ 100
METRIC RATING
207th/ 347
METRIC RANK
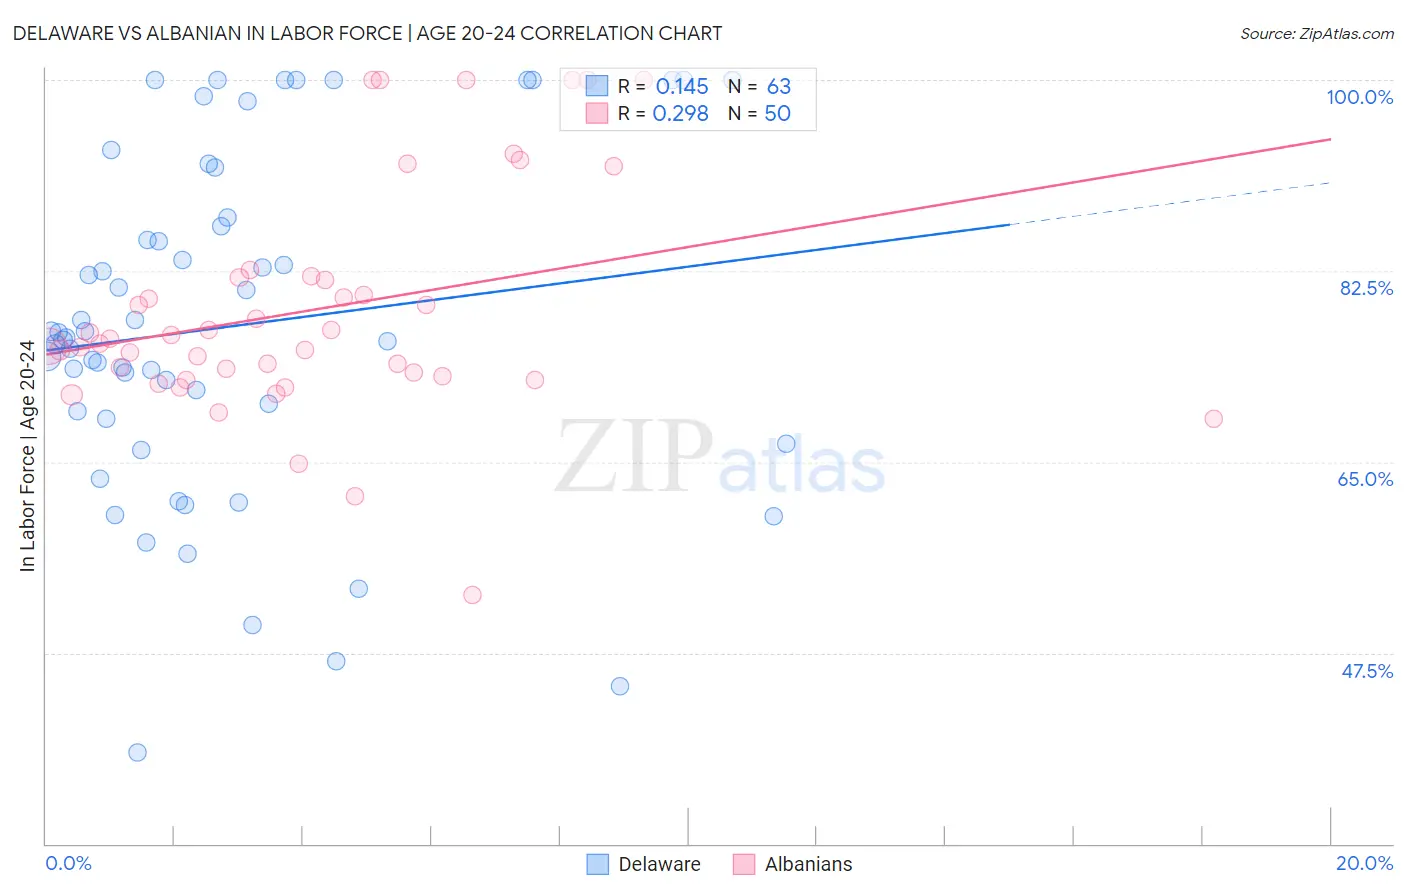
Delaware vs Albanian In Labor Force | Age 20-24 Correlation Chart
The statistical analysis conducted on geographies consisting of 96,225,060 people shows a poor positive correlation between the proportion of Delaware and labor force participation rate among population between the ages 20 and 24 in the United States with a correlation coefficient (R) of 0.145 and weighted average of 75.5%. Similarly, the statistical analysis conducted on geographies consisting of 193,237,710 people shows a weak positive correlation between the proportion of Albanians and labor force participation rate among population between the ages 20 and 24 in the United States with a correlation coefficient (R) of 0.298 and weighted average of 74.6%, a difference of 1.2%.
In Labor Force | Age 20-24 Correlation Summary
| Measurement | Delaware | Albanian |
| Minimum | 38.4% | 52.8% |
| Maximum | 100.0% | 100.0% |
| Range | 61.6% | 47.2% |
| Mean | 77.4% | 79.0% |
| Median | 76.4% | 76.0% |
| Interquartile 25% (IQ1) | 69.0% | 72.9% |
| Interquartile 75% (IQ3) | 87.4% | 81.9% |
| Interquartile Range (IQR) | 18.4% | 9.0% |
| Standard Deviation (Sample) | 15.6% | 10.5% |
| Standard Deviation (Population) | 15.4% | 10.4% |
Similar Demographics by In Labor Force | Age 20-24
Demographics Similar to Delaware by In Labor Force | Age 20-24
In terms of in labor force | age 20-24, the demographic groups most similar to Delaware are Immigrants from England (75.5%, a difference of 0.0%), Immigrants from Brazil (75.5%, a difference of 0.010%), Jordanian (75.5%, a difference of 0.010%), Australian (75.5%, a difference of 0.010%), and Romanian (75.5%, a difference of 0.010%).
| Demographics | Rating | Rank | In Labor Force | Age 20-24 |
| Zimbabweans | 88.2 /100 | #133 | Excellent 75.6% |
| Estonians | 87.1 /100 | #134 | Excellent 75.6% |
| Yaqui | 85.5 /100 | #135 | Excellent 75.5% |
| Immigrants | Brazil | 84.8 /100 | #136 | Excellent 75.5% |
| Jordanians | 84.8 /100 | #137 | Excellent 75.5% |
| Australians | 84.8 /100 | #138 | Excellent 75.5% |
| Immigrants | England | 84.6 /100 | #139 | Excellent 75.5% |
| Delaware | 84.5 /100 | #140 | Excellent 75.5% |
| Romanians | 84.1 /100 | #141 | Excellent 75.5% |
| Blackfeet | 83.6 /100 | #142 | Excellent 75.5% |
| Spaniards | 82.0 /100 | #143 | Excellent 75.5% |
| Bhutanese | 80.8 /100 | #144 | Excellent 75.4% |
| Koreans | 79.7 /100 | #145 | Good 75.4% |
| Mexican American Indians | 78.8 /100 | #146 | Good 75.4% |
| Comanche | 77.6 /100 | #147 | Good 75.4% |
Demographics Similar to Albanians by In Labor Force | Age 20-24
In terms of in labor force | age 20-24, the demographic groups most similar to Albanians are Immigrants from Uruguay (74.6%, a difference of 0.010%), Arab (74.6%, a difference of 0.010%), Sioux (74.6%, a difference of 0.030%), Uruguayan (74.6%, a difference of 0.030%), and Immigrants from Northern Africa (74.6%, a difference of 0.040%).
| Demographics | Rating | Rank | In Labor Force | Age 20-24 |
| Nigerians | 21.9 /100 | #200 | Fair 74.7% |
| Choctaw | 21.4 /100 | #201 | Fair 74.7% |
| Moroccans | 20.4 /100 | #202 | Fair 74.7% |
| Immigrants | Northern Africa | 17.9 /100 | #203 | Poor 74.6% |
| Immigrants | Italy | 17.6 /100 | #204 | Poor 74.6% |
| Inupiat | 17.6 /100 | #205 | Poor 74.6% |
| Sioux | 17.5 /100 | #206 | Poor 74.6% |
| Albanians | 16.2 /100 | #207 | Poor 74.6% |
| Immigrants | Uruguay | 15.8 /100 | #208 | Poor 74.6% |
| Arabs | 15.8 /100 | #209 | Poor 74.6% |
| Uruguayans | 15.1 /100 | #210 | Poor 74.6% |
| Immigrants | Australia | 14.7 /100 | #211 | Poor 74.6% |
| Creek | 13.3 /100 | #212 | Poor 74.5% |
| Peruvians | 13.3 /100 | #213 | Poor 74.5% |
| Immigrants | Southern Europe | 13.2 /100 | #214 | Poor 74.5% |