Burmese vs Albanian In Labor Force | Age 45-54
COMPARE
Burmese
Albanian
In Labor Force | Age 45-54
In Labor Force | Age 45-54 Comparison
Burmese
Albanians
83.6%
IN LABOR FORCE | AGE 45-54
99.1/ 100
METRIC RATING
44th/ 347
METRIC RANK
83.3%
IN LABOR FORCE | AGE 45-54
93.9/ 100
METRIC RATING
103rd/ 347
METRIC RANK
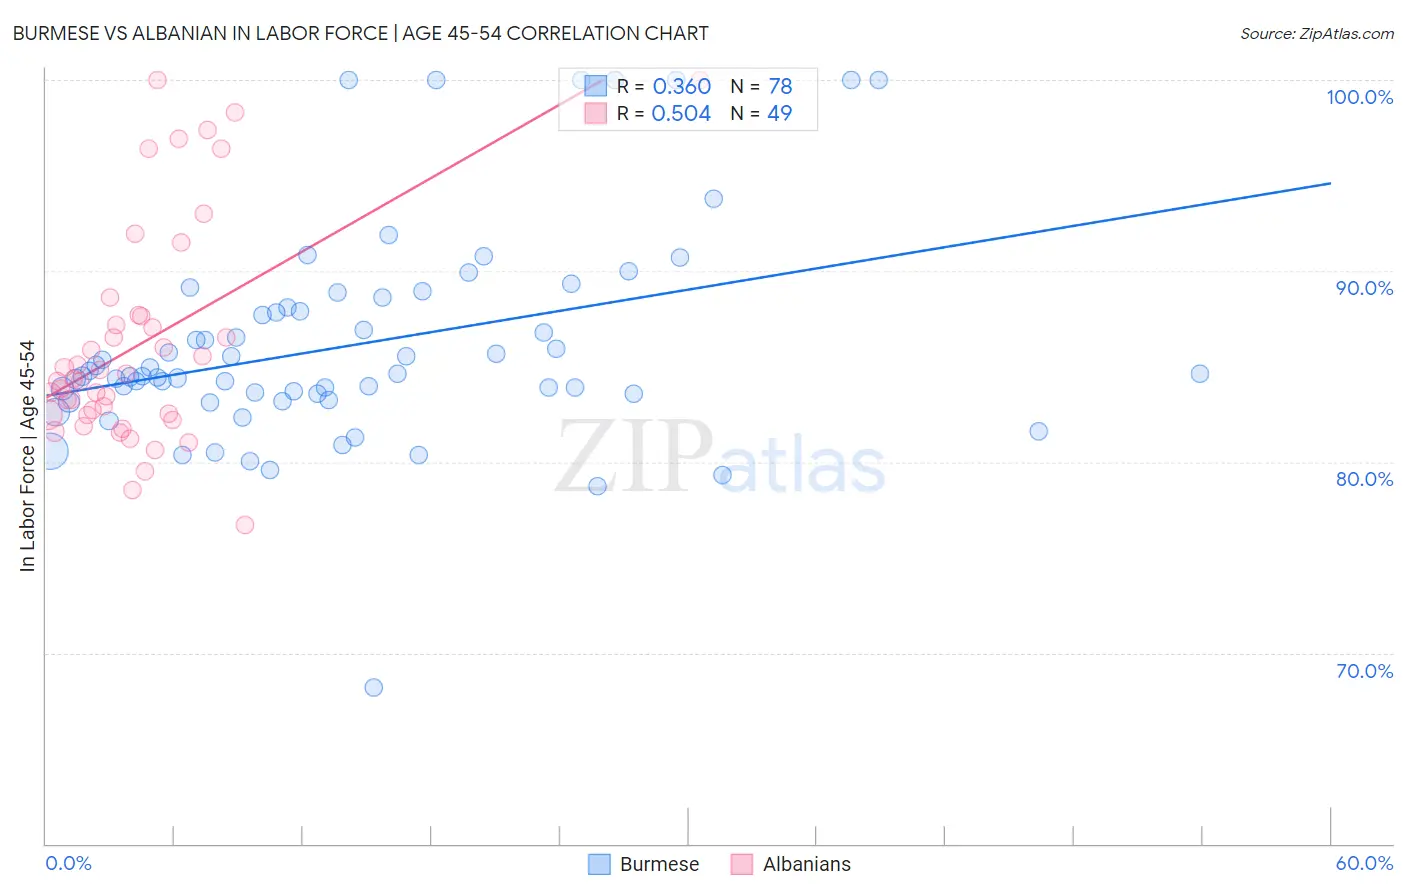
Burmese vs Albanian In Labor Force | Age 45-54 Correlation Chart
The statistical analysis conducted on geographies consisting of 464,867,064 people shows a mild positive correlation between the proportion of Burmese and labor force participation rate among population between the ages 45 and 54 in the United States with a correlation coefficient (R) of 0.360 and weighted average of 83.6%. Similarly, the statistical analysis conducted on geographies consisting of 193,191,598 people shows a substantial positive correlation between the proportion of Albanians and labor force participation rate among population between the ages 45 and 54 in the United States with a correlation coefficient (R) of 0.504 and weighted average of 83.3%, a difference of 0.43%.
In Labor Force | Age 45-54 Correlation Summary
| Measurement | Burmese | Albanian |
| Minimum | 68.2% | 76.7% |
| Maximum | 100.0% | 100.0% |
| Range | 31.8% | 23.3% |
| Mean | 86.1% | 86.2% |
| Median | 84.5% | 84.3% |
| Interquartile 25% (IQ1) | 83.6% | 82.5% |
| Interquartile 75% (IQ3) | 88.1% | 87.7% |
| Interquartile Range (IQR) | 4.5% | 5.2% |
| Standard Deviation (Sample) | 5.7% | 5.8% |
| Standard Deviation (Population) | 5.6% | 5.7% |
Similar Demographics by In Labor Force | Age 45-54
Demographics Similar to Burmese by In Labor Force | Age 45-54
In terms of in labor force | age 45-54, the demographic groups most similar to Burmese are Immigrants from Hong Kong (83.6%, a difference of 0.0%), Lithuanian (83.6%, a difference of 0.010%), Venezuelan (83.6%, a difference of 0.020%), Croatian (83.6%, a difference of 0.030%), and Immigrants from Poland (83.6%, a difference of 0.030%).
| Demographics | Rating | Rank | In Labor Force | Age 45-54 |
| Swedes | 99.4 /100 | #37 | Exceptional 83.7% |
| Immigrants | Venezuela | 99.4 /100 | #38 | Exceptional 83.7% |
| Immigrants | Cuba | 99.4 /100 | #39 | Exceptional 83.7% |
| Immigrants | Uganda | 99.4 /100 | #40 | Exceptional 83.7% |
| Immigrants | Korea | 99.3 /100 | #41 | Exceptional 83.7% |
| Immigrants | Moldova | 99.3 /100 | #42 | Exceptional 83.7% |
| Venezuelans | 99.2 /100 | #43 | Exceptional 83.6% |
| Burmese | 99.1 /100 | #44 | Exceptional 83.6% |
| Immigrants | Hong Kong | 99.1 /100 | #45 | Exceptional 83.6% |
| Lithuanians | 99.1 /100 | #46 | Exceptional 83.6% |
| Croatians | 99.0 /100 | #47 | Exceptional 83.6% |
| Immigrants | Poland | 99.0 /100 | #48 | Exceptional 83.6% |
| Immigrants | Morocco | 99.0 /100 | #49 | Exceptional 83.6% |
| Immigrants | Greece | 98.8 /100 | #50 | Exceptional 83.6% |
| Immigrants | Turkey | 98.8 /100 | #51 | Exceptional 83.6% |
Demographics Similar to Albanians by In Labor Force | Age 45-54
In terms of in labor force | age 45-54, the demographic groups most similar to Albanians are Immigrants from Singapore (83.3%, a difference of 0.0%), Immigrants from Romania (83.3%, a difference of 0.0%), Immigrants from Middle Africa (83.3%, a difference of 0.010%), Mongolian (83.3%, a difference of 0.010%), and Immigrants from Belarus (83.3%, a difference of 0.010%).
| Demographics | Rating | Rank | In Labor Force | Age 45-54 |
| Immigrants | Kuwait | 94.8 /100 | #96 | Exceptional 83.3% |
| Palestinians | 94.8 /100 | #97 | Exceptional 83.3% |
| Maltese | 94.4 /100 | #98 | Exceptional 83.3% |
| Immigrants | Middle Africa | 94.3 /100 | #99 | Exceptional 83.3% |
| Mongolians | 94.2 /100 | #100 | Exceptional 83.3% |
| Immigrants | Belarus | 94.1 /100 | #101 | Exceptional 83.3% |
| Immigrants | Singapore | 93.9 /100 | #102 | Exceptional 83.3% |
| Albanians | 93.9 /100 | #103 | Exceptional 83.3% |
| Immigrants | Romania | 93.8 /100 | #104 | Exceptional 83.3% |
| Immigrants | South America | 93.5 /100 | #105 | Exceptional 83.2% |
| Sri Lankans | 93.2 /100 | #106 | Exceptional 83.2% |
| Iranians | 92.9 /100 | #107 | Exceptional 83.2% |
| Slovaks | 92.8 /100 | #108 | Exceptional 83.2% |
| Ukrainians | 92.7 /100 | #109 | Exceptional 83.2% |
| Immigrants | Africa | 92.6 /100 | #110 | Exceptional 83.2% |