Danish vs Cypriot In Labor Force | Age > 16
COMPARE
Danish
Cypriot
In Labor Force | Age > 16
In Labor Force | Age > 16 Comparison
Danes
Cypriots
65.3%
IN LABOR FORCE | AGE > 16
68.8/ 100
METRIC RATING
164th/ 347
METRIC RANK
65.5%
IN LABOR FORCE | AGE > 16
88.2/ 100
METRIC RATING
146th/ 347
METRIC RANK
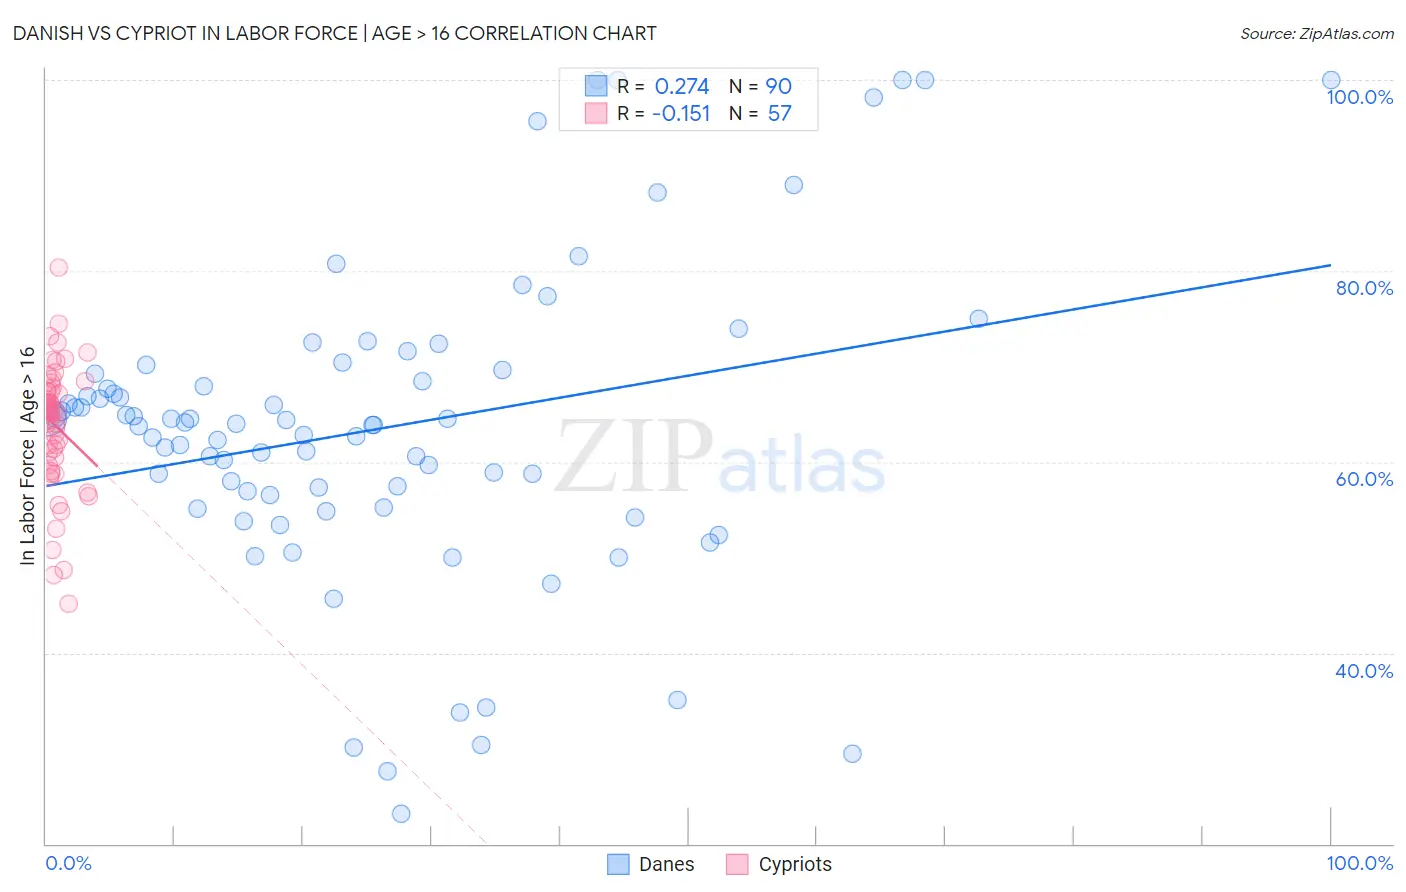
Danish vs Cypriot In Labor Force | Age > 16 Correlation Chart
The statistical analysis conducted on geographies consisting of 474,191,872 people shows a weak positive correlation between the proportion of Danes and labor force participation rate among population ages 16 and over in the United States with a correlation coefficient (R) of 0.274 and weighted average of 65.3%. Similarly, the statistical analysis conducted on geographies consisting of 61,870,589 people shows a poor negative correlation between the proportion of Cypriots and labor force participation rate among population ages 16 and over in the United States with a correlation coefficient (R) of -0.151 and weighted average of 65.5%, a difference of 0.34%.
In Labor Force | Age > 16 Correlation Summary
| Measurement | Danish | Cypriot |
| Minimum | 23.1% | 45.1% |
| Maximum | 100.0% | 80.3% |
| Range | 76.9% | 35.2% |
| Mean | 63.4% | 63.8% |
| Median | 63.9% | 65.3% |
| Interquartile 25% (IQ1) | 56.6% | 60.1% |
| Interquartile 75% (IQ3) | 69.2% | 67.6% |
| Interquartile Range (IQR) | 12.7% | 7.6% |
| Standard Deviation (Sample) | 16.2% | 6.7% |
| Standard Deviation (Population) | 16.1% | 6.6% |
Demographics Similar to Danes and Cypriots by In Labor Force | Age > 16
In terms of in labor force | age > 16, the demographic groups most similar to Danes are South African (65.3%, a difference of 0.010%), Immigrants from Kazakhstan (65.3%, a difference of 0.010%), Australian (65.3%, a difference of 0.030%), Albanian (65.3%, a difference of 0.030%), and Immigrants from South Africa (65.3%, a difference of 0.060%). Similarly, the demographic groups most similar to Cypriots are Tlingit-Haida (65.5%, a difference of 0.0%), Immigrants from Oceania (65.5%, a difference of 0.020%), Bhutanese (65.5%, a difference of 0.050%), Immigrants from Albania (65.4%, a difference of 0.060%), and Immigrants (65.4%, a difference of 0.14%).
| Demographics | Rating | Rank | In Labor Force | Age > 16 |
| Tlingit-Haida | 88.3 /100 | #145 | Excellent 65.5% |
| Cypriots | 88.2 /100 | #146 | Excellent 65.5% |
| Immigrants | Oceania | 87.5 /100 | #147 | Excellent 65.5% |
| Bhutanese | 86.3 /100 | #148 | Excellent 65.5% |
| Immigrants | Albania | 85.7 /100 | #149 | Excellent 65.4% |
| Immigrants | Immigrants | 81.9 /100 | #150 | Excellent 65.4% |
| Czechs | 81.5 /100 | #151 | Excellent 65.4% |
| Yugoslavians | 81.3 /100 | #152 | Excellent 65.4% |
| Immigrants | China | 80.5 /100 | #153 | Excellent 65.4% |
| Immigrants | Eastern Europe | 78.3 /100 | #154 | Good 65.4% |
| Immigrants | Armenia | 76.6 /100 | #155 | Good 65.3% |
| Immigrants | Ireland | 75.9 /100 | #156 | Good 65.3% |
| Immigrants | Russia | 75.7 /100 | #157 | Good 65.3% |
| Panamanians | 75.2 /100 | #158 | Good 65.3% |
| Immigrants | Syria | 74.6 /100 | #159 | Good 65.3% |
| Immigrants | South Africa | 73.5 /100 | #160 | Good 65.3% |
| Australians | 71.3 /100 | #161 | Good 65.3% |
| Albanians | 70.8 /100 | #162 | Good 65.3% |
| South Africans | 69.8 /100 | #163 | Good 65.3% |
| Danes | 68.8 /100 | #164 | Good 65.3% |
| Immigrants | Kazakhstan | 68.1 /100 | #165 | Good 65.3% |