Czechoslovakian vs Finnish In Labor Force | Age 25-29
COMPARE
Czechoslovakian
Finnish
In Labor Force | Age 25-29
In Labor Force | Age 25-29 Comparison
Czechoslovakians
Finns
85.0%
IN LABOR FORCE | AGE 25-29
92.6/ 100
METRIC RATING
106th/ 347
METRIC RANK
85.0%
IN LABOR FORCE | AGE 25-29
87.8/ 100
METRIC RATING
118th/ 347
METRIC RANK
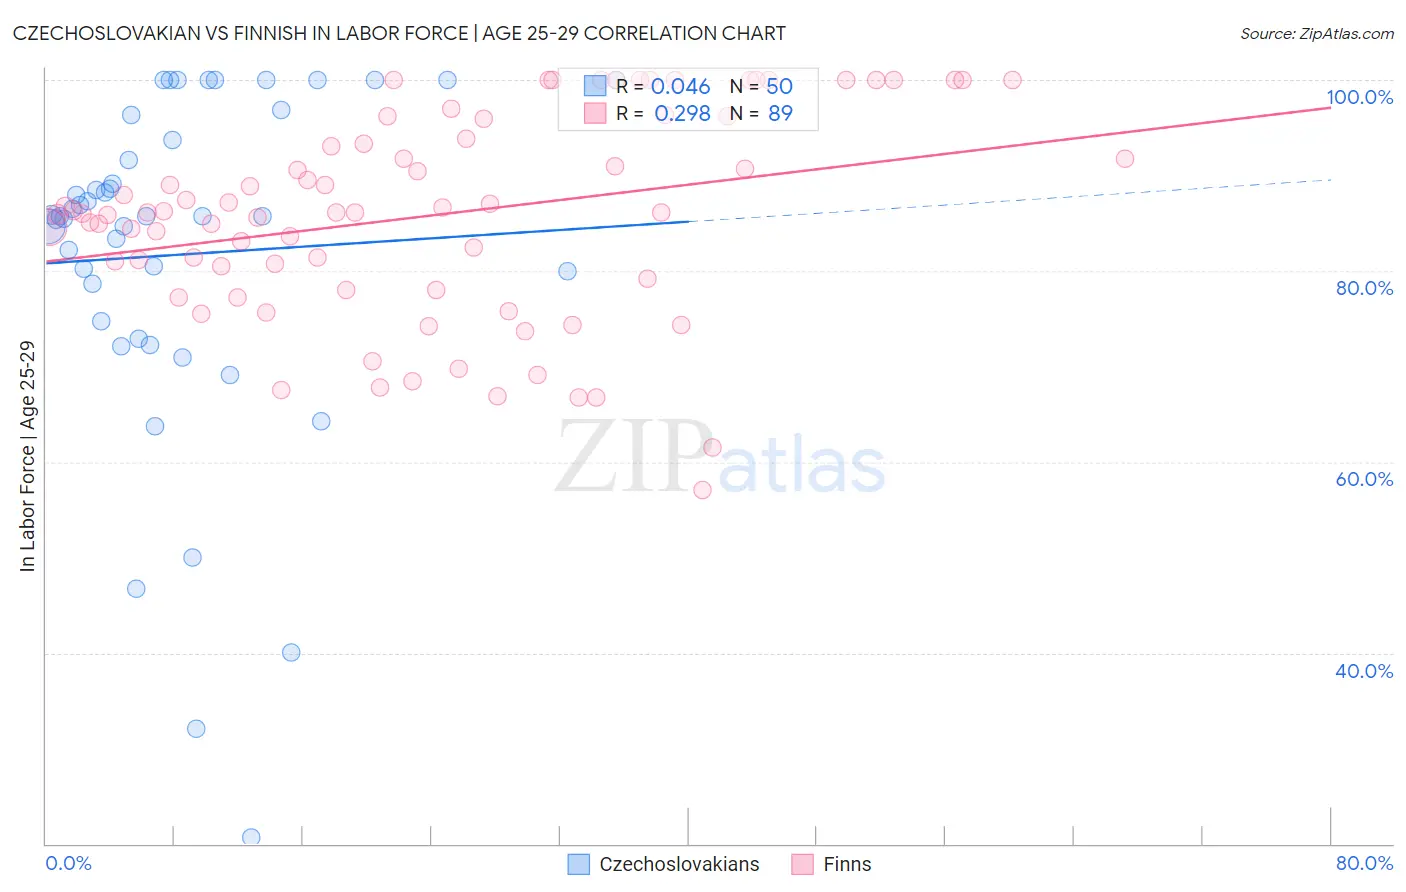
Czechoslovakian vs Finnish In Labor Force | Age 25-29 Correlation Chart
The statistical analysis conducted on geographies consisting of 368,503,594 people shows no correlation between the proportion of Czechoslovakians and labor force participation rate among population between the ages 25 and 29 in the United States with a correlation coefficient (R) of 0.046 and weighted average of 85.0%. Similarly, the statistical analysis conducted on geographies consisting of 404,431,499 people shows a weak positive correlation between the proportion of Finns and labor force participation rate among population between the ages 25 and 29 in the United States with a correlation coefficient (R) of 0.298 and weighted average of 85.0%, a difference of 0.10%.
In Labor Force | Age 25-29 Correlation Summary
| Measurement | Czechoslovakian | Finnish |
| Minimum | 20.6% | 57.1% |
| Maximum | 100.0% | 100.0% |
| Range | 79.4% | 42.9% |
| Mean | 81.7% | 85.8% |
| Median | 85.7% | 86.2% |
| Interquartile 25% (IQ1) | 74.7% | 78.6% |
| Interquartile 75% (IQ3) | 93.7% | 94.9% |
| Interquartile Range (IQR) | 19.1% | 16.3% |
| Standard Deviation (Sample) | 18.0% | 10.6% |
| Standard Deviation (Population) | 17.8% | 10.6% |
Demographics Similar to Czechoslovakians and Finns by In Labor Force | Age 25-29
In terms of in labor force | age 25-29, the demographic groups most similar to Czechoslovakians are Immigrants from Hong Kong (85.0%, a difference of 0.0%), Immigrants from Southern Europe (85.0%, a difference of 0.010%), Immigrants from Zaire (85.1%, a difference of 0.020%), Immigrants from Austria (85.0%, a difference of 0.020%), and Costa Rican (85.0%, a difference of 0.020%). Similarly, the demographic groups most similar to Finns are Immigrants from Belarus (85.0%, a difference of 0.0%), Filipino (84.9%, a difference of 0.010%), South African (85.0%, a difference of 0.020%), Chilean (85.0%, a difference of 0.020%), and Immigrants from South Africa (84.9%, a difference of 0.030%).
| Demographics | Rating | Rank | In Labor Force | Age 25-29 |
| Slavs | 93.7 /100 | #102 | Exceptional 85.1% |
| Immigrants | Japan | 93.5 /100 | #103 | Exceptional 85.1% |
| Immigrants | Zaire | 93.3 /100 | #104 | Exceptional 85.1% |
| Immigrants | Hong Kong | 92.8 /100 | #105 | Exceptional 85.0% |
| Czechoslovakians | 92.6 /100 | #106 | Exceptional 85.0% |
| Immigrants | Southern Europe | 92.3 /100 | #107 | Exceptional 85.0% |
| Immigrants | Austria | 91.9 /100 | #108 | Exceptional 85.0% |
| Costa Ricans | 91.9 /100 | #109 | Exceptional 85.0% |
| New Zealanders | 91.5 /100 | #110 | Exceptional 85.0% |
| Immigrants | Middle Africa | 91.4 /100 | #111 | Exceptional 85.0% |
| Senegalese | 90.9 /100 | #112 | Exceptional 85.0% |
| Irish | 90.6 /100 | #113 | Exceptional 85.0% |
| Immigrants | Malaysia | 90.4 /100 | #114 | Exceptional 85.0% |
| South Africans | 88.9 /100 | #115 | Excellent 85.0% |
| Chileans | 88.8 /100 | #116 | Excellent 85.0% |
| Immigrants | Belarus | 88.0 /100 | #117 | Excellent 85.0% |
| Finns | 87.8 /100 | #118 | Excellent 85.0% |
| Filipinos | 87.1 /100 | #119 | Excellent 84.9% |
| Immigrants | South Africa | 86.1 /100 | #120 | Excellent 84.9% |
| Immigrants | Chile | 85.6 /100 | #121 | Excellent 84.9% |
| Scandinavians | 85.1 /100 | #122 | Excellent 84.9% |