Vietnamese vs Finnish In Labor Force | Age 25-29
COMPARE
Vietnamese
Finnish
In Labor Force | Age 25-29
In Labor Force | Age 25-29 Comparison
Vietnamese
Finns
82.8%
IN LABOR FORCE | AGE 25-29
0.0/ 100
METRIC RATING
301st/ 347
METRIC RANK
85.0%
IN LABOR FORCE | AGE 25-29
87.8/ 100
METRIC RATING
118th/ 347
METRIC RANK
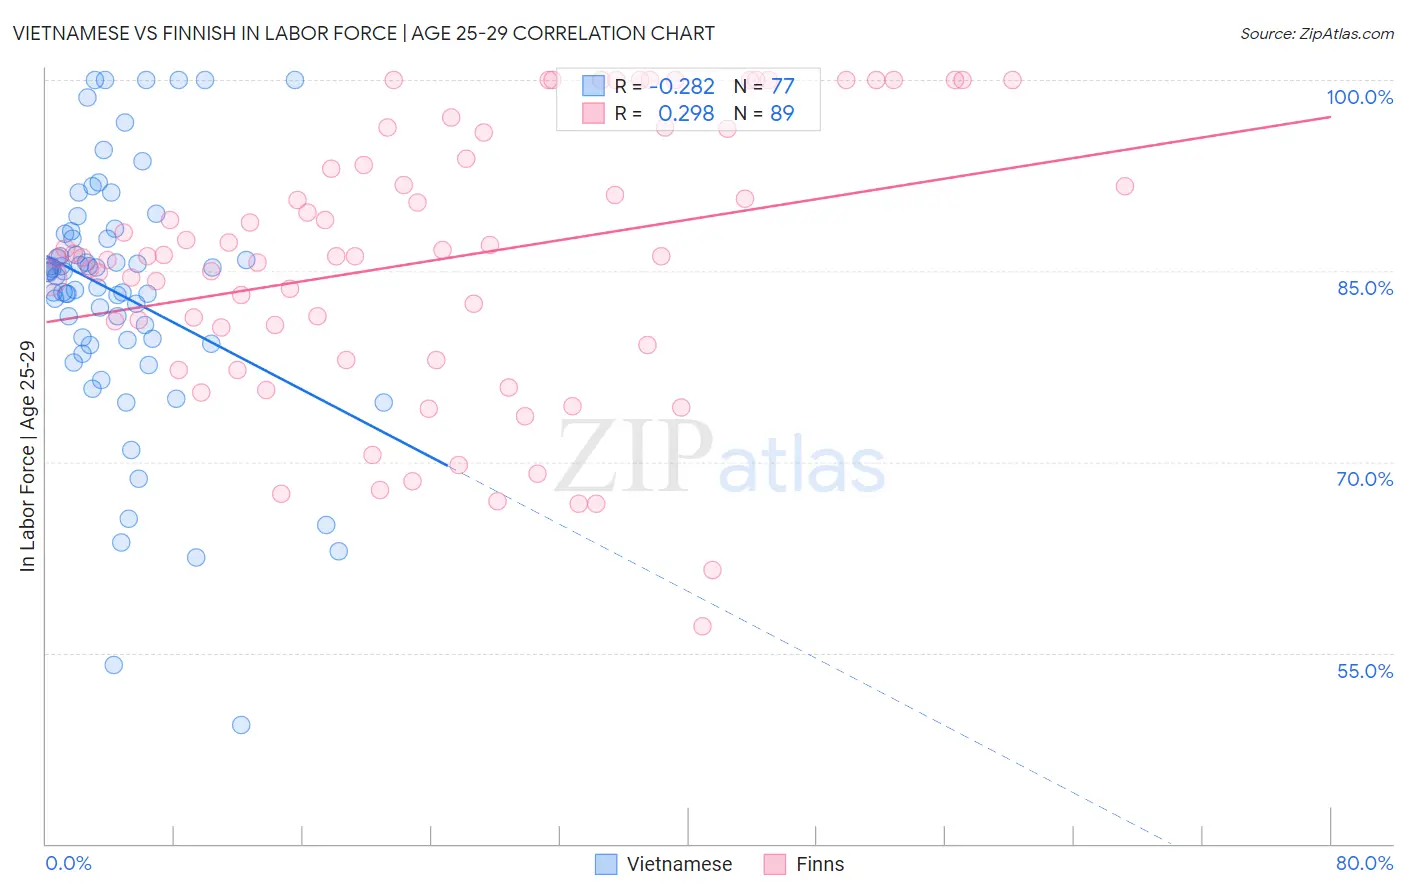
Vietnamese vs Finnish In Labor Force | Age 25-29 Correlation Chart
The statistical analysis conducted on geographies consisting of 170,737,570 people shows a weak negative correlation between the proportion of Vietnamese and labor force participation rate among population between the ages 25 and 29 in the United States with a correlation coefficient (R) of -0.282 and weighted average of 82.8%. Similarly, the statistical analysis conducted on geographies consisting of 404,431,499 people shows a weak positive correlation between the proportion of Finns and labor force participation rate among population between the ages 25 and 29 in the United States with a correlation coefficient (R) of 0.298 and weighted average of 85.0%, a difference of 2.6%.
In Labor Force | Age 25-29 Correlation Summary
| Measurement | Vietnamese | Finnish |
| Minimum | 49.3% | 57.1% |
| Maximum | 100.0% | 100.0% |
| Range | 50.7% | 42.9% |
| Mean | 83.1% | 85.8% |
| Median | 84.9% | 86.2% |
| Interquartile 25% (IQ1) | 79.4% | 78.6% |
| Interquartile 75% (IQ3) | 87.7% | 94.9% |
| Interquartile Range (IQR) | 8.3% | 16.3% |
| Standard Deviation (Sample) | 10.0% | 10.6% |
| Standard Deviation (Population) | 9.9% | 10.6% |
Similar Demographics by In Labor Force | Age 25-29
Demographics Similar to Vietnamese by In Labor Force | Age 25-29
In terms of in labor force | age 25-29, the demographic groups most similar to Vietnamese are Immigrants from Belize (82.8%, a difference of 0.030%), Immigrants from Grenada (82.8%, a difference of 0.050%), Spanish American Indian (82.9%, a difference of 0.070%), Fijian (82.9%, a difference of 0.080%), and Native Hawaiian (82.9%, a difference of 0.090%).
| Demographics | Rating | Rank | In Labor Force | Age 25-29 |
| Nepalese | 0.0 /100 | #294 | Tragic 82.9% |
| Chippewa | 0.0 /100 | #295 | Tragic 82.9% |
| Immigrants | Nicaragua | 0.0 /100 | #296 | Tragic 82.9% |
| Potawatomi | 0.0 /100 | #297 | Tragic 82.9% |
| Native Hawaiians | 0.0 /100 | #298 | Tragic 82.9% |
| Fijians | 0.0 /100 | #299 | Tragic 82.9% |
| Spanish American Indians | 0.0 /100 | #300 | Tragic 82.9% |
| Vietnamese | 0.0 /100 | #301 | Tragic 82.8% |
| Immigrants | Belize | 0.0 /100 | #302 | Tragic 82.8% |
| Immigrants | Grenada | 0.0 /100 | #303 | Tragic 82.8% |
| Immigrants | St. Vincent and the Grenadines | 0.0 /100 | #304 | Tragic 82.7% |
| Blacks/African Americans | 0.0 /100 | #305 | Tragic 82.6% |
| Blackfeet | 0.0 /100 | #306 | Tragic 82.6% |
| Cajuns | 0.0 /100 | #307 | Tragic 82.5% |
| Central American Indians | 0.0 /100 | #308 | Tragic 82.4% |
Demographics Similar to Finns by In Labor Force | Age 25-29
In terms of in labor force | age 25-29, the demographic groups most similar to Finns are Immigrants from Belarus (85.0%, a difference of 0.0%), Filipino (84.9%, a difference of 0.010%), South African (85.0%, a difference of 0.020%), Chilean (85.0%, a difference of 0.020%), and Immigrants from South Africa (84.9%, a difference of 0.030%).
| Demographics | Rating | Rank | In Labor Force | Age 25-29 |
| Immigrants | Middle Africa | 91.4 /100 | #111 | Exceptional 85.0% |
| Senegalese | 90.9 /100 | #112 | Exceptional 85.0% |
| Irish | 90.6 /100 | #113 | Exceptional 85.0% |
| Immigrants | Malaysia | 90.4 /100 | #114 | Exceptional 85.0% |
| South Africans | 88.9 /100 | #115 | Excellent 85.0% |
| Chileans | 88.8 /100 | #116 | Excellent 85.0% |
| Immigrants | Belarus | 88.0 /100 | #117 | Excellent 85.0% |
| Finns | 87.8 /100 | #118 | Excellent 85.0% |
| Filipinos | 87.1 /100 | #119 | Excellent 84.9% |
| Immigrants | South Africa | 86.1 /100 | #120 | Excellent 84.9% |
| Immigrants | Chile | 85.6 /100 | #121 | Excellent 84.9% |
| Scandinavians | 85.1 /100 | #122 | Excellent 84.9% |
| Dutch | 84.9 /100 | #123 | Excellent 84.9% |
| Immigrants | Iran | 84.8 /100 | #124 | Excellent 84.9% |
| Uruguayans | 84.7 /100 | #125 | Excellent 84.9% |