Czechoslovakian vs Finnish Master's Degree
COMPARE
Czechoslovakian
Finnish
Master's Degree
Master's Degree Comparison
Czechoslovakians
Finns
14.5%
MASTER'S DEGREE
29.9/ 100
METRIC RATING
196th/ 347
METRIC RANK
14.2%
MASTER'S DEGREE
16.9/ 100
METRIC RATING
214th/ 347
METRIC RANK
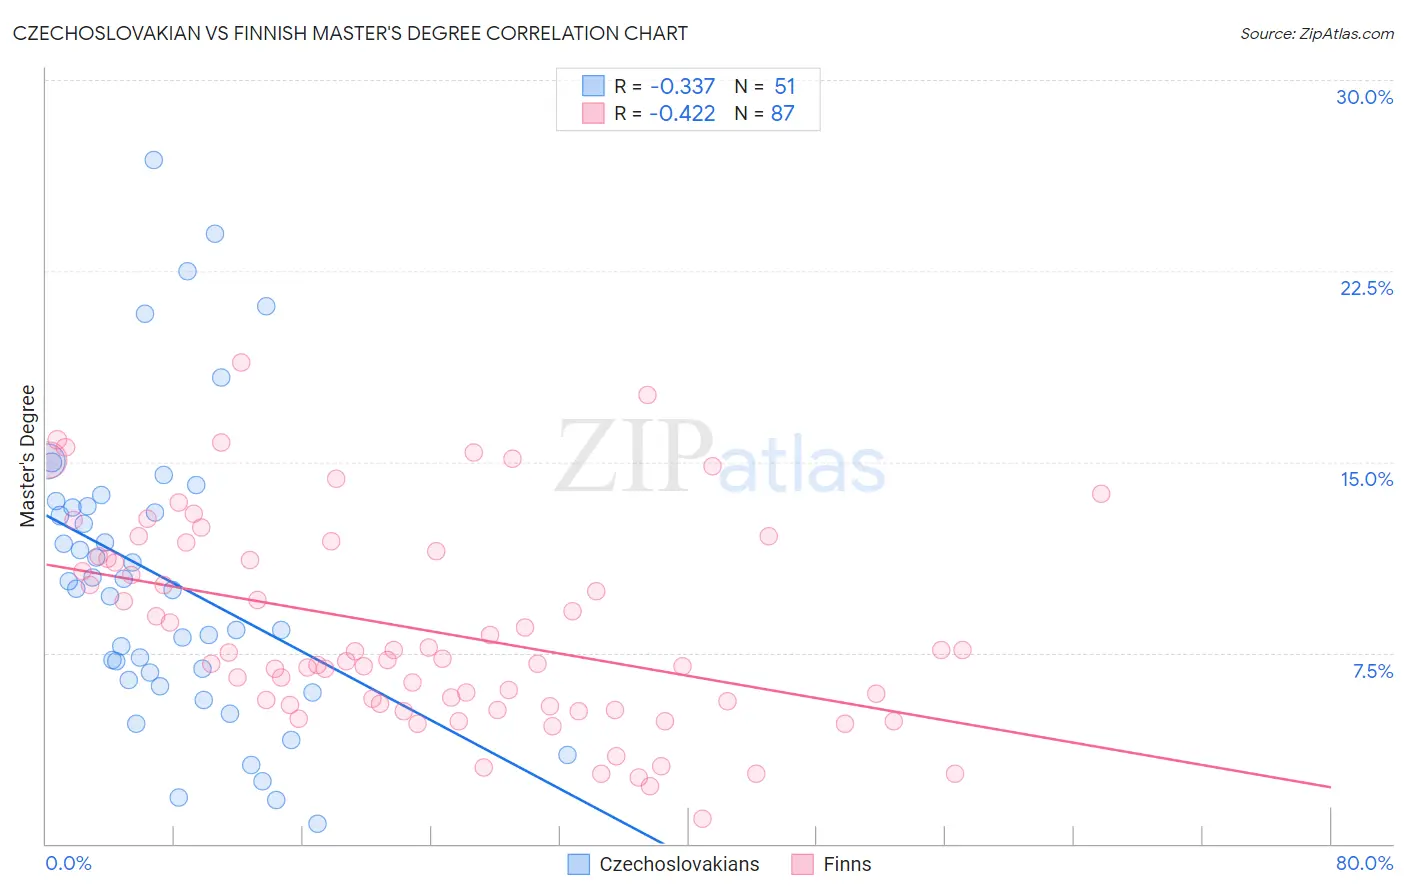
Czechoslovakian vs Finnish Master's Degree Correlation Chart
The statistical analysis conducted on geographies consisting of 368,562,573 people shows a mild negative correlation between the proportion of Czechoslovakians and percentage of population with at least master's degree education in the United States with a correlation coefficient (R) of -0.337 and weighted average of 14.5%. Similarly, the statistical analysis conducted on geographies consisting of 404,580,183 people shows a moderate negative correlation between the proportion of Finns and percentage of population with at least master's degree education in the United States with a correlation coefficient (R) of -0.422 and weighted average of 14.2%, a difference of 2.5%.
Master's Degree Correlation Summary
| Measurement | Czechoslovakian | Finnish |
| Minimum | 0.78% | 1.0% |
| Maximum | 26.9% | 18.9% |
| Range | 26.1% | 17.9% |
| Mean | 10.4% | 8.4% |
| Median | 10.0% | 7.3% |
| Interquartile 25% (IQ1) | 6.4% | 5.4% |
| Interquartile 75% (IQ3) | 13.3% | 11.3% |
| Interquartile Range (IQR) | 6.8% | 5.8% |
| Standard Deviation (Sample) | 5.8% | 4.0% |
| Standard Deviation (Population) | 5.7% | 4.0% |
Demographics Similar to Czechoslovakians and Finns by Master's Degree
In terms of master's degree, the demographic groups most similar to Czechoslovakians are Danish (14.5%, a difference of 0.22%), Belgian (14.5%, a difference of 0.31%), West Indian (14.5%, a difference of 0.41%), Immigrants from Armenia (14.5%, a difference of 0.44%), and Panamanian (14.4%, a difference of 0.81%). Similarly, the demographic groups most similar to Finns are Immigrants from Thailand (14.2%, a difference of 0.010%), Spanish (14.2%, a difference of 0.20%), Immigrants from Vietnam (14.1%, a difference of 0.21%), Somali (14.2%, a difference of 0.25%), and Subsaharan African (14.2%, a difference of 0.57%).
| Demographics | Rating | Rank | Master's Degree |
| Danes | 31.3 /100 | #195 | Fair 14.5% |
| Czechoslovakians | 29.9 /100 | #196 | Fair 14.5% |
| Belgians | 28.0 /100 | #197 | Fair 14.5% |
| West Indians | 27.4 /100 | #198 | Fair 14.5% |
| Immigrants | Armenia | 27.2 /100 | #199 | Fair 14.5% |
| Panamanians | 25.1 /100 | #200 | Fair 14.4% |
| Scotch-Irish | 25.0 /100 | #201 | Fair 14.4% |
| Immigrants | Western Africa | 24.9 /100 | #202 | Fair 14.4% |
| Yugoslavians | 24.3 /100 | #203 | Fair 14.4% |
| French | 23.7 /100 | #204 | Fair 14.4% |
| Trinidadians and Tobagonians | 23.5 /100 | #205 | Fair 14.4% |
| Scandinavians | 23.3 /100 | #206 | Fair 14.4% |
| Immigrants | Bosnia and Herzegovina | 22.0 /100 | #207 | Fair 14.3% |
| Immigrants | Barbados | 20.5 /100 | #208 | Fair 14.3% |
| Immigrants | Panama | 20.0 /100 | #209 | Fair 14.3% |
| Sub-Saharan Africans | 19.4 /100 | #210 | Poor 14.2% |
| Somalis | 18.0 /100 | #211 | Poor 14.2% |
| Spanish | 17.8 /100 | #212 | Poor 14.2% |
| Immigrants | Thailand | 17.0 /100 | #213 | Poor 14.2% |
| Finns | 16.9 /100 | #214 | Poor 14.2% |
| Immigrants | Vietnam | 16.1 /100 | #215 | Poor 14.1% |