French vs Finnish In Labor Force | Age 25-29
COMPARE
French
Finnish
In Labor Force | Age 25-29
In Labor Force | Age 25-29 Comparison
French
Finns
84.7%
IN LABOR FORCE | AGE 25-29
61.0/ 100
METRIC RATING
156th/ 347
METRIC RANK
85.0%
IN LABOR FORCE | AGE 25-29
87.8/ 100
METRIC RATING
118th/ 347
METRIC RANK
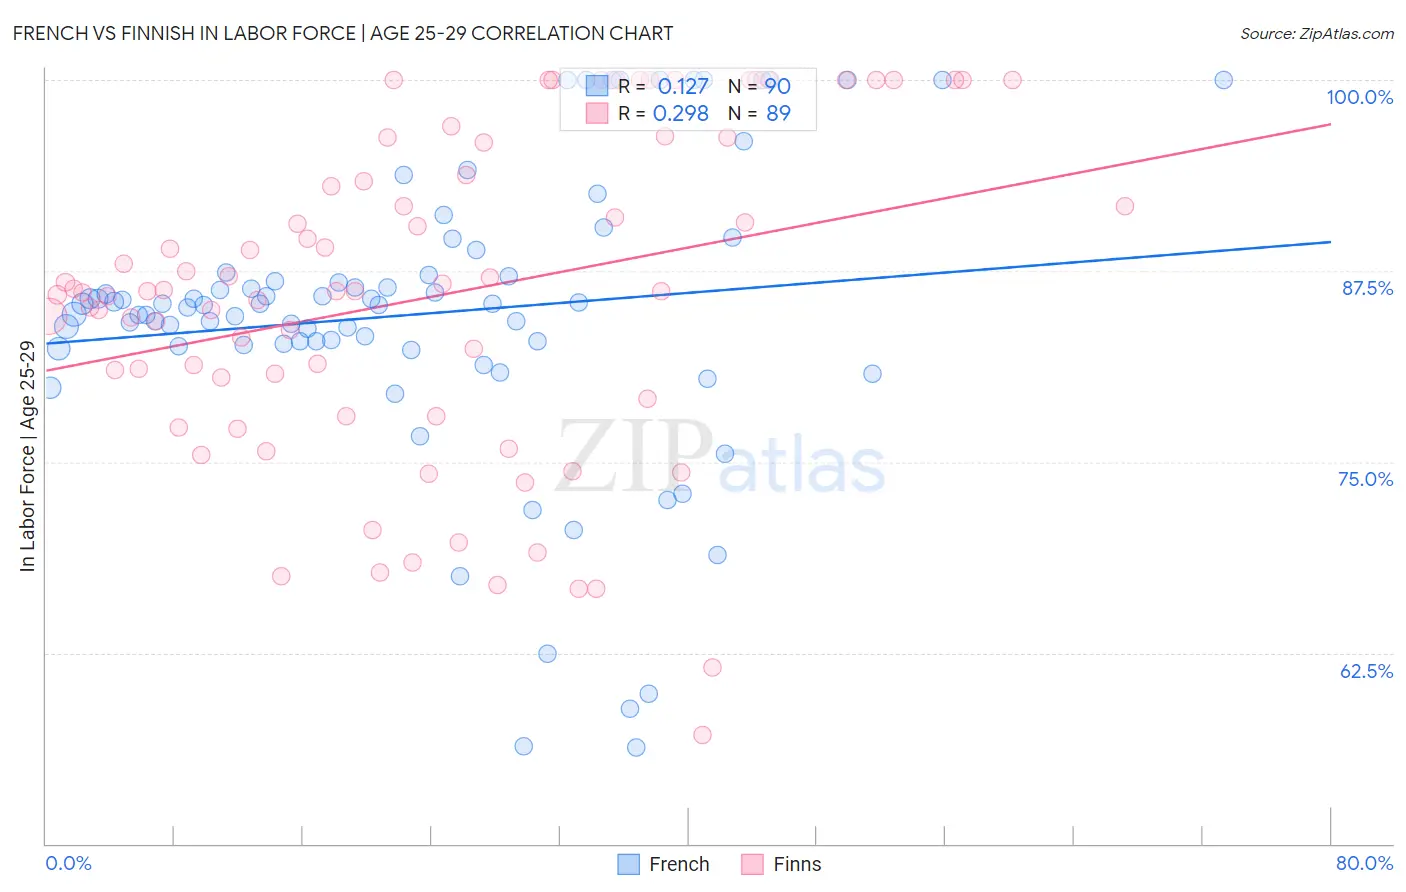
French vs Finnish In Labor Force | Age 25-29 Correlation Chart
The statistical analysis conducted on geographies consisting of 571,081,449 people shows a poor positive correlation between the proportion of French and labor force participation rate among population between the ages 25 and 29 in the United States with a correlation coefficient (R) of 0.127 and weighted average of 84.7%. Similarly, the statistical analysis conducted on geographies consisting of 404,431,499 people shows a weak positive correlation between the proportion of Finns and labor force participation rate among population between the ages 25 and 29 in the United States with a correlation coefficient (R) of 0.298 and weighted average of 85.0%, a difference of 0.28%.
In Labor Force | Age 25-29 Correlation Summary
| Measurement | French | Finnish |
| Minimum | 56.3% | 57.1% |
| Maximum | 100.0% | 100.0% |
| Range | 43.7% | 42.9% |
| Mean | 84.7% | 85.8% |
| Median | 85.3% | 86.2% |
| Interquartile 25% (IQ1) | 82.7% | 78.6% |
| Interquartile 75% (IQ3) | 87.2% | 94.9% |
| Interquartile Range (IQR) | 4.5% | 16.3% |
| Standard Deviation (Sample) | 9.6% | 10.6% |
| Standard Deviation (Population) | 9.6% | 10.6% |
Similar Demographics by In Labor Force | Age 25-29
Demographics Similar to French by In Labor Force | Age 25-29
In terms of in labor force | age 25-29, the demographic groups most similar to French are Immigrants from Sri Lanka (84.7%, a difference of 0.0%), Indian (Asian) (84.7%, a difference of 0.0%), British (84.7%, a difference of 0.0%), Colombian (84.7%, a difference of 0.010%), and Immigrants from Pakistan (84.7%, a difference of 0.010%).
| Demographics | Rating | Rank | In Labor Force | Age 25-29 |
| Peruvians | 64.7 /100 | #149 | Good 84.7% |
| Swiss | 64.7 /100 | #150 | Good 84.7% |
| Colombians | 62.8 /100 | #151 | Good 84.7% |
| Immigrants | Pakistan | 62.7 /100 | #152 | Good 84.7% |
| Immigrants | Taiwan | 62.2 /100 | #153 | Good 84.7% |
| Immigrants | Sri Lanka | 61.7 /100 | #154 | Good 84.7% |
| Indians (Asian) | 61.6 /100 | #155 | Good 84.7% |
| French | 61.0 /100 | #156 | Good 84.7% |
| British | 60.4 /100 | #157 | Good 84.7% |
| Immigrants | Ghana | 60.2 /100 | #158 | Good 84.7% |
| Immigrants | Western Africa | 60.1 /100 | #159 | Good 84.7% |
| Immigrants | Peru | 58.6 /100 | #160 | Average 84.7% |
| Canadians | 58.5 /100 | #161 | Average 84.7% |
| Immigrants | Colombia | 58.3 /100 | #162 | Average 84.7% |
| Argentineans | 57.9 /100 | #163 | Average 84.7% |
Demographics Similar to Finns by In Labor Force | Age 25-29
In terms of in labor force | age 25-29, the demographic groups most similar to Finns are Immigrants from Belarus (85.0%, a difference of 0.0%), Filipino (84.9%, a difference of 0.010%), South African (85.0%, a difference of 0.020%), Chilean (85.0%, a difference of 0.020%), and Immigrants from South Africa (84.9%, a difference of 0.030%).
| Demographics | Rating | Rank | In Labor Force | Age 25-29 |
| Immigrants | Middle Africa | 91.4 /100 | #111 | Exceptional 85.0% |
| Senegalese | 90.9 /100 | #112 | Exceptional 85.0% |
| Irish | 90.6 /100 | #113 | Exceptional 85.0% |
| Immigrants | Malaysia | 90.4 /100 | #114 | Exceptional 85.0% |
| South Africans | 88.9 /100 | #115 | Excellent 85.0% |
| Chileans | 88.8 /100 | #116 | Excellent 85.0% |
| Immigrants | Belarus | 88.0 /100 | #117 | Excellent 85.0% |
| Finns | 87.8 /100 | #118 | Excellent 85.0% |
| Filipinos | 87.1 /100 | #119 | Excellent 84.9% |
| Immigrants | South Africa | 86.1 /100 | #120 | Excellent 84.9% |
| Immigrants | Chile | 85.6 /100 | #121 | Excellent 84.9% |
| Scandinavians | 85.1 /100 | #122 | Excellent 84.9% |
| Dutch | 84.9 /100 | #123 | Excellent 84.9% |
| Immigrants | Iran | 84.8 /100 | #124 | Excellent 84.9% |
| Uruguayans | 84.7 /100 | #125 | Excellent 84.9% |