Hopi vs Finnish In Labor Force | Age 25-29
COMPARE
Hopi
Finnish
In Labor Force | Age 25-29
In Labor Force | Age 25-29 Comparison
Hopi
Finns
76.5%
IN LABOR FORCE | AGE 25-29
0.0/ 100
METRIC RATING
344th/ 347
METRIC RANK
85.0%
IN LABOR FORCE | AGE 25-29
87.8/ 100
METRIC RATING
118th/ 347
METRIC RANK
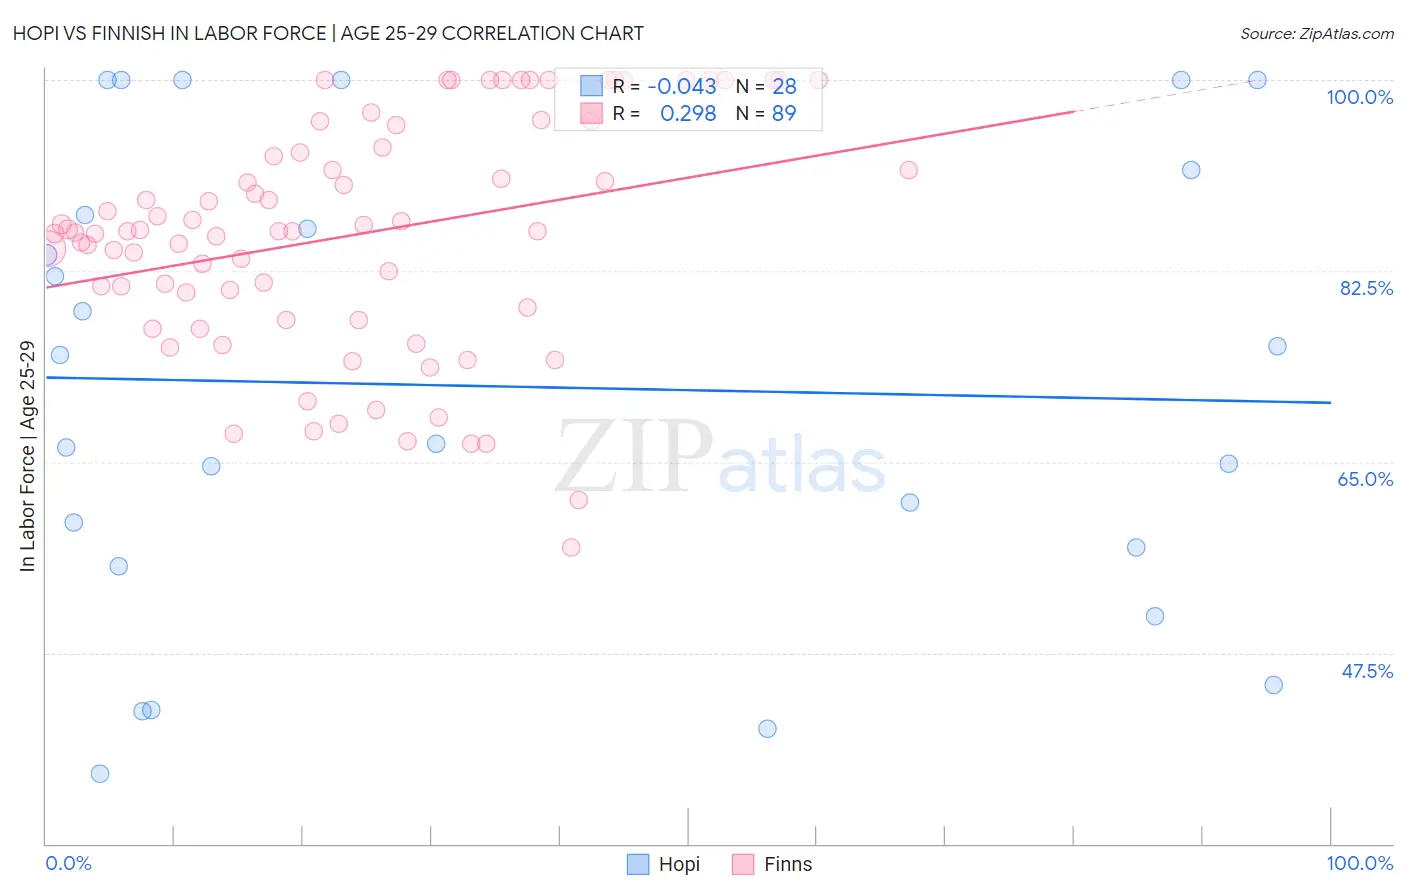
Hopi vs Finnish In Labor Force | Age 25-29 Correlation Chart
The statistical analysis conducted on geographies consisting of 74,722,734 people shows no correlation between the proportion of Hopi and labor force participation rate among population between the ages 25 and 29 in the United States with a correlation coefficient (R) of -0.043 and weighted average of 76.5%. Similarly, the statistical analysis conducted on geographies consisting of 404,431,499 people shows a weak positive correlation between the proportion of Finns and labor force participation rate among population between the ages 25 and 29 in the United States with a correlation coefficient (R) of 0.298 and weighted average of 85.0%, a difference of 11.0%.
In Labor Force | Age 25-29 Correlation Summary
| Measurement | Hopi | Finnish |
| Minimum | 36.4% | 57.1% |
| Maximum | 100.0% | 100.0% |
| Range | 63.6% | 42.9% |
| Mean | 71.9% | 85.8% |
| Median | 70.8% | 86.2% |
| Interquartile 25% (IQ1) | 56.3% | 78.6% |
| Interquartile 75% (IQ3) | 89.7% | 94.9% |
| Interquartile Range (IQR) | 33.4% | 16.3% |
| Standard Deviation (Sample) | 21.1% | 10.6% |
| Standard Deviation (Population) | 20.7% | 10.6% |
Similar Demographics by In Labor Force | Age 25-29
Demographics Similar to Hopi by In Labor Force | Age 25-29
In terms of in labor force | age 25-29, the demographic groups most similar to Hopi are Arapaho (76.6%, a difference of 0.060%), Pueblo (77.5%, a difference of 1.3%), Tohono O'odham (77.5%, a difference of 1.3%), Paiute (78.1%, a difference of 2.1%), and Immigrants from Yemen (78.2%, a difference of 2.2%).
| Demographics | Rating | Rank | In Labor Force | Age 25-29 |
| Sioux | 0.0 /100 | #333 | Tragic 79.7% |
| Yuman | 0.0 /100 | #334 | Tragic 79.3% |
| Natives/Alaskans | 0.0 /100 | #335 | Tragic 79.3% |
| Apache | 0.0 /100 | #336 | Tragic 79.2% |
| Crow | 0.0 /100 | #337 | Tragic 78.6% |
| Lumbee | 0.0 /100 | #338 | Tragic 78.3% |
| Immigrants | Yemen | 0.0 /100 | #339 | Tragic 78.2% |
| Paiute | 0.0 /100 | #340 | Tragic 78.1% |
| Tohono O'odham | 0.0 /100 | #341 | Tragic 77.5% |
| Pueblo | 0.0 /100 | #342 | Tragic 77.5% |
| Arapaho | 0.0 /100 | #343 | Tragic 76.6% |
| Hopi | 0.0 /100 | #344 | Tragic 76.5% |
| Navajo | 0.0 /100 | #345 | Tragic 74.6% |
| Pima | 0.0 /100 | #346 | Tragic 74.3% |
| Yup'ik | 0.0 /100 | #347 | Tragic 73.1% |
Demographics Similar to Finns by In Labor Force | Age 25-29
In terms of in labor force | age 25-29, the demographic groups most similar to Finns are Immigrants from Belarus (85.0%, a difference of 0.0%), Filipino (84.9%, a difference of 0.010%), South African (85.0%, a difference of 0.020%), Chilean (85.0%, a difference of 0.020%), and Immigrants from South Africa (84.9%, a difference of 0.030%).
| Demographics | Rating | Rank | In Labor Force | Age 25-29 |
| Immigrants | Middle Africa | 91.4 /100 | #111 | Exceptional 85.0% |
| Senegalese | 90.9 /100 | #112 | Exceptional 85.0% |
| Irish | 90.6 /100 | #113 | Exceptional 85.0% |
| Immigrants | Malaysia | 90.4 /100 | #114 | Exceptional 85.0% |
| South Africans | 88.9 /100 | #115 | Excellent 85.0% |
| Chileans | 88.8 /100 | #116 | Excellent 85.0% |
| Immigrants | Belarus | 88.0 /100 | #117 | Excellent 85.0% |
| Finns | 87.8 /100 | #118 | Excellent 85.0% |
| Filipinos | 87.1 /100 | #119 | Excellent 84.9% |
| Immigrants | South Africa | 86.1 /100 | #120 | Excellent 84.9% |
| Immigrants | Chile | 85.6 /100 | #121 | Excellent 84.9% |
| Scandinavians | 85.1 /100 | #122 | Excellent 84.9% |
| Dutch | 84.9 /100 | #123 | Excellent 84.9% |
| Immigrants | Iran | 84.8 /100 | #124 | Excellent 84.9% |
| Uruguayans | 84.7 /100 | #125 | Excellent 84.9% |