Immigrants from Haiti vs South African In Labor Force | Age 20-64
COMPARE
Immigrants from Haiti
South African
In Labor Force | Age 20-64
In Labor Force | Age 20-64 Comparison
Immigrants from Haiti
South Africans
79.4%
IN LABOR FORCE | AGE 20-64
32.1/ 100
METRIC RATING
188th/ 347
METRIC RANK
79.7%
IN LABOR FORCE | AGE 20-64
66.2/ 100
METRIC RATING
161st/ 347
METRIC RANK
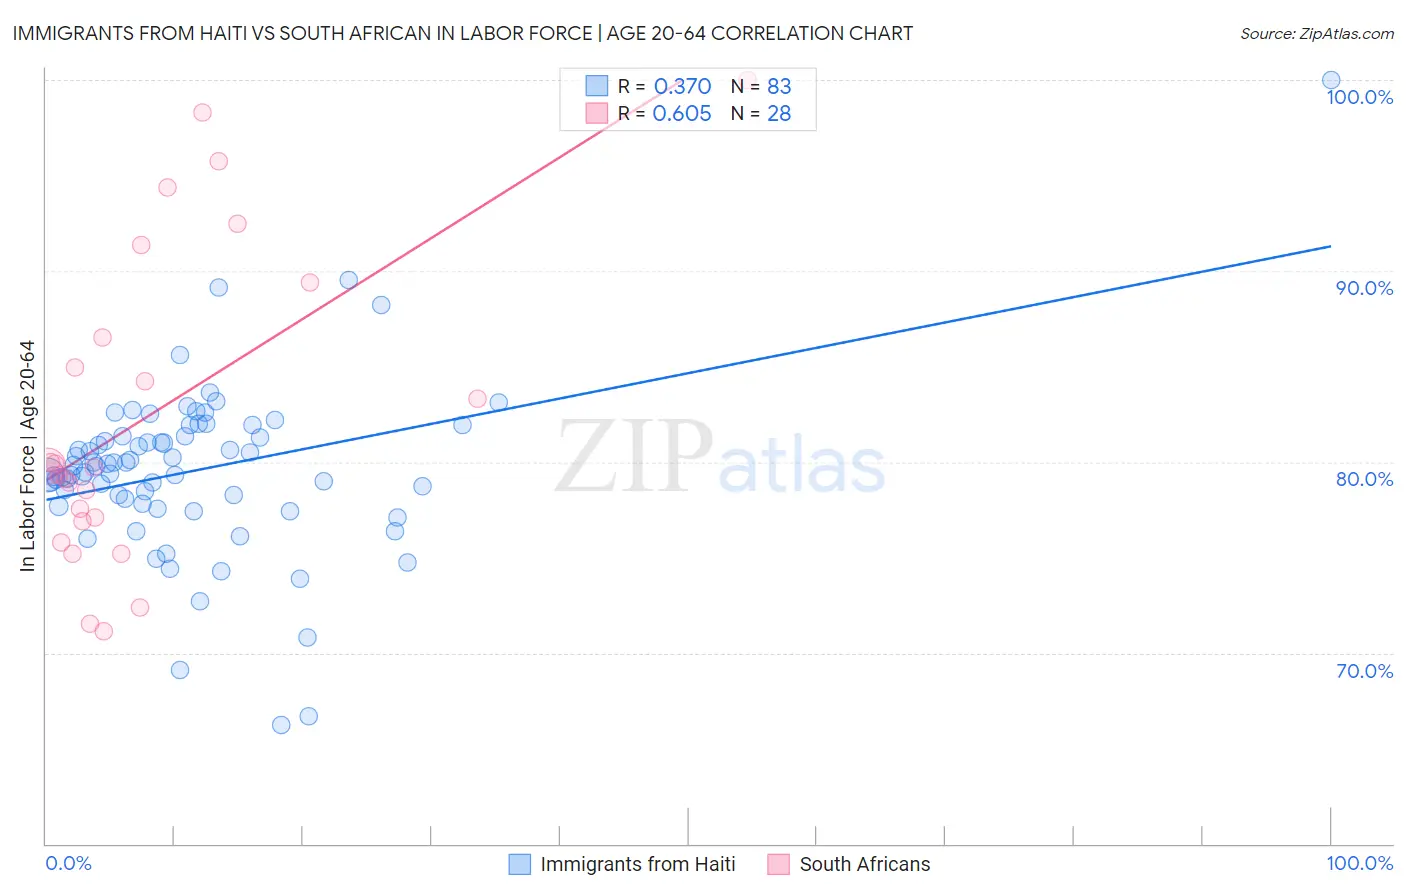
Immigrants from Haiti vs South African In Labor Force | Age 20-64 Correlation Chart
The statistical analysis conducted on geographies consisting of 225,284,201 people shows a mild positive correlation between the proportion of Immigrants from Haiti and labor force participation rate among population between the ages 20 and 64 in the United States with a correlation coefficient (R) of 0.370 and weighted average of 79.4%. Similarly, the statistical analysis conducted on geographies consisting of 182,600,467 people shows a significant positive correlation between the proportion of South Africans and labor force participation rate among population between the ages 20 and 64 in the United States with a correlation coefficient (R) of 0.605 and weighted average of 79.7%, a difference of 0.29%.
In Labor Force | Age 20-64 Correlation Summary
| Measurement | Immigrants from Haiti | South African |
| Minimum | 66.2% | 71.1% |
| Maximum | 100.0% | 100.0% |
| Range | 33.8% | 28.9% |
| Mean | 79.6% | 82.4% |
| Median | 79.8% | 79.7% |
| Interquartile 25% (IQ1) | 77.8% | 77.0% |
| Interquartile 75% (IQ3) | 81.4% | 88.0% |
| Interquartile Range (IQR) | 3.5% | 11.0% |
| Standard Deviation (Sample) | 4.5% | 8.1% |
| Standard Deviation (Population) | 4.5% | 8.0% |
Similar Demographics by In Labor Force | Age 20-64
Demographics Similar to Immigrants from Haiti by In Labor Force | Age 20-64
In terms of in labor force | age 20-64, the demographic groups most similar to Immigrants from Haiti are Assyrian/Chaldean/Syriac (79.4%, a difference of 0.010%), Immigrants from El Salvador (79.4%, a difference of 0.010%), Immigrants from Syria (79.4%, a difference of 0.010%), Israeli (79.5%, a difference of 0.020%), and Northern European (79.5%, a difference of 0.020%).
| Demographics | Rating | Rank | In Labor Force | Age 20-64 |
| Immigrants | Saudi Arabia | 37.7 /100 | #181 | Fair 79.5% |
| Malaysians | 37.1 /100 | #182 | Fair 79.5% |
| Immigrants | Hungary | 36.8 /100 | #183 | Fair 79.5% |
| Finns | 35.9 /100 | #184 | Fair 79.5% |
| Israelis | 34.7 /100 | #185 | Fair 79.5% |
| Northern Europeans | 34.5 /100 | #186 | Fair 79.5% |
| Assyrians/Chaldeans/Syriacs | 33.3 /100 | #187 | Fair 79.4% |
| Immigrants | Haiti | 32.1 /100 | #188 | Fair 79.4% |
| Immigrants | El Salvador | 30.9 /100 | #189 | Fair 79.4% |
| Immigrants | Syria | 30.8 /100 | #190 | Fair 79.4% |
| Swiss | 28.9 /100 | #191 | Fair 79.4% |
| Immigrants | Denmark | 26.9 /100 | #192 | Fair 79.4% |
| Indonesians | 26.1 /100 | #193 | Fair 79.4% |
| Immigrants | Thailand | 24.8 /100 | #194 | Fair 79.4% |
| Immigrants | Austria | 23.7 /100 | #195 | Fair 79.4% |
Demographics Similar to South Africans by In Labor Force | Age 20-64
In terms of in labor force | age 20-64, the demographic groups most similar to South Africans are Immigrants from Cuba (79.7%, a difference of 0.0%), Moroccan (79.7%, a difference of 0.0%), Austrian (79.7%, a difference of 0.010%), German (79.7%, a difference of 0.010%), and Immigrants from Costa Rica (79.7%, a difference of 0.010%).
| Demographics | Rating | Rank | In Labor Force | Age 20-64 |
| New Zealanders | 69.4 /100 | #154 | Good 79.7% |
| Immigrants | South Africa | 69.2 /100 | #155 | Good 79.7% |
| Senegalese | 69.1 /100 | #156 | Good 79.7% |
| Immigrants | China | 69.1 /100 | #157 | Good 79.7% |
| Austrians | 67.6 /100 | #158 | Good 79.7% |
| Immigrants | Cuba | 66.7 /100 | #159 | Good 79.7% |
| Moroccans | 66.7 /100 | #160 | Good 79.7% |
| South Africans | 66.2 /100 | #161 | Good 79.7% |
| Germans | 65.2 /100 | #162 | Good 79.7% |
| Immigrants | Costa Rica | 64.6 /100 | #163 | Good 79.7% |
| Immigrants | Burma/Myanmar | 64.4 /100 | #164 | Good 79.7% |
| Nigerians | 64.0 /100 | #165 | Good 79.7% |
| Okinawans | 62.7 /100 | #166 | Good 79.6% |
| Immigrants | Iraq | 62.0 /100 | #167 | Good 79.6% |
| Immigrants | Indonesia | 61.8 /100 | #168 | Good 79.6% |