Cypriot vs Immigrants from Belgium In Labor Force | Age 20-64
COMPARE
Cypriot
Immigrants from Belgium
In Labor Force | Age 20-64
In Labor Force | Age 20-64 Comparison
Cypriots
Immigrants from Belgium
80.2%
IN LABOR FORCE | AGE 20-64
98.2/ 100
METRIC RATING
73rd/ 347
METRIC RANK
79.6%
IN LABOR FORCE | AGE 20-64
53.1/ 100
METRIC RATING
172nd/ 347
METRIC RANK
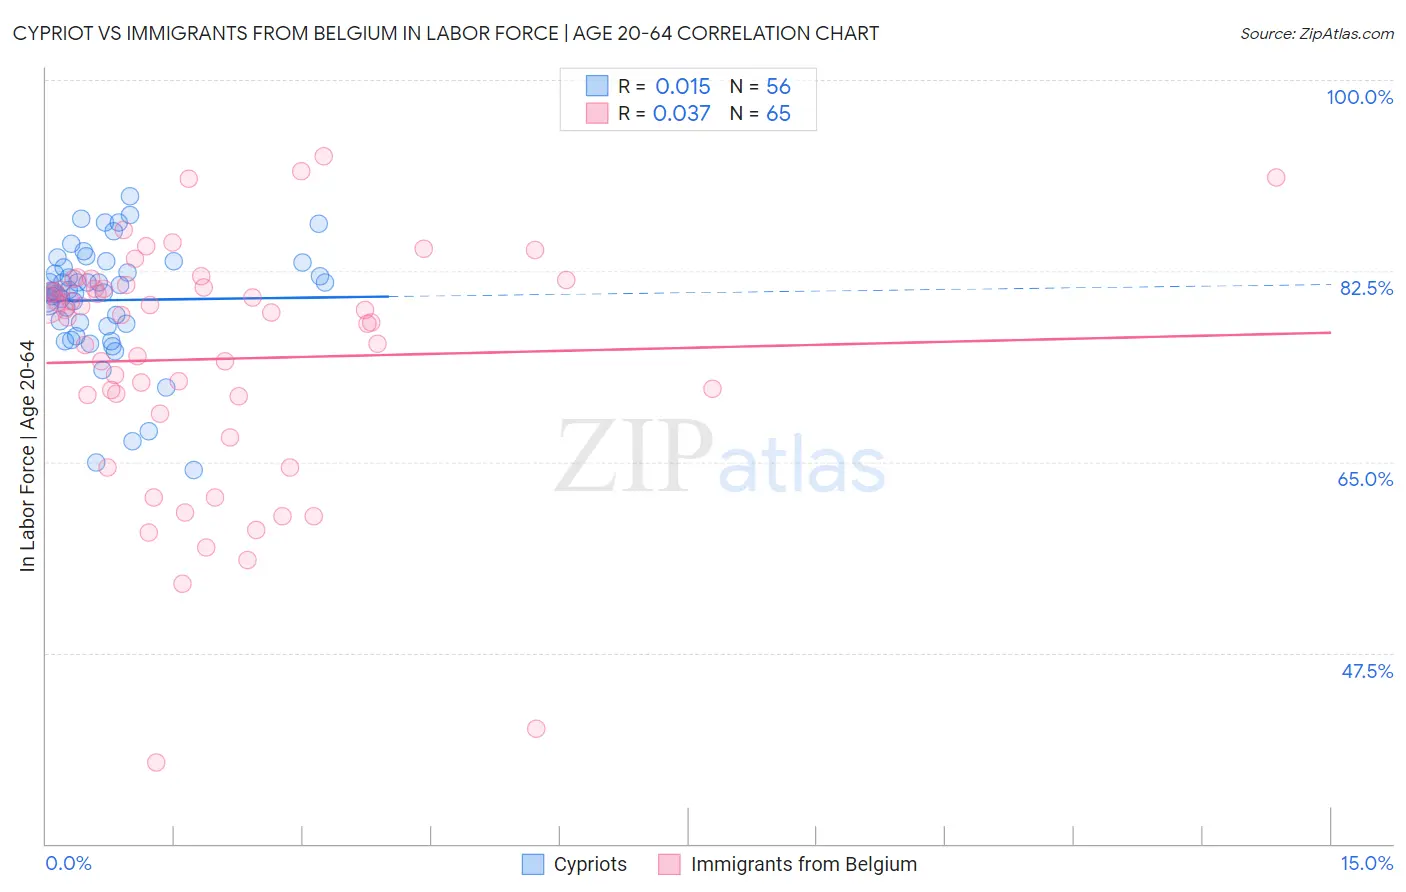
Cypriot vs Immigrants from Belgium In Labor Force | Age 20-64 Correlation Chart
The statistical analysis conducted on geographies consisting of 61,869,277 people shows no correlation between the proportion of Cypriots and labor force participation rate among population between the ages 20 and 64 in the United States with a correlation coefficient (R) of 0.015 and weighted average of 80.2%. Similarly, the statistical analysis conducted on geographies consisting of 146,728,908 people shows no correlation between the proportion of Immigrants from Belgium and labor force participation rate among population between the ages 20 and 64 in the United States with a correlation coefficient (R) of 0.037 and weighted average of 79.6%, a difference of 0.77%.
In Labor Force | Age 20-64 Correlation Summary
| Measurement | Cypriot | Immigrants from Belgium |
| Minimum | 64.2% | 37.4% |
| Maximum | 89.4% | 93.0% |
| Range | 25.2% | 55.6% |
| Mean | 79.8% | 74.4% |
| Median | 80.7% | 78.5% |
| Interquartile 25% (IQ1) | 77.5% | 70.2% |
| Interquartile 75% (IQ3) | 83.1% | 81.1% |
| Interquartile Range (IQR) | 5.5% | 10.9% |
| Standard Deviation (Sample) | 5.4% | 11.2% |
| Standard Deviation (Population) | 5.3% | 11.1% |
Similar Demographics by In Labor Force | Age 20-64
Demographics Similar to Cypriots by In Labor Force | Age 20-64
In terms of in labor force | age 20-64, the demographic groups most similar to Cypriots are Immigrants from Eastern Europe (80.2%, a difference of 0.010%), Immigrants from Afghanistan (80.2%, a difference of 0.020%), Eastern European (80.2%, a difference of 0.030%), Immigrants from Turkey (80.2%, a difference of 0.040%), and Soviet Union (80.2%, a difference of 0.040%).
| Demographics | Rating | Rank | In Labor Force | Age 20-64 |
| Macedonians | 98.7 /100 | #66 | Exceptional 80.2% |
| Taiwanese | 98.6 /100 | #67 | Exceptional 80.2% |
| Bhutanese | 98.6 /100 | #68 | Exceptional 80.2% |
| Albanians | 98.6 /100 | #69 | Exceptional 80.2% |
| Immigrants | Turkey | 98.5 /100 | #70 | Exceptional 80.2% |
| Soviet Union | 98.5 /100 | #71 | Exceptional 80.2% |
| Eastern Europeans | 98.4 /100 | #72 | Exceptional 80.2% |
| Cypriots | 98.2 /100 | #73 | Exceptional 80.2% |
| Immigrants | Eastern Europe | 98.1 /100 | #74 | Exceptional 80.2% |
| Immigrants | Afghanistan | 97.9 /100 | #75 | Exceptional 80.2% |
| Egyptians | 97.8 /100 | #76 | Exceptional 80.2% |
| Immigrants | Colombia | 97.8 /100 | #77 | Exceptional 80.2% |
| Immigrants | Romania | 97.8 /100 | #78 | Exceptional 80.2% |
| Asians | 97.7 /100 | #79 | Exceptional 80.2% |
| Immigrants | Croatia | 97.6 /100 | #80 | Exceptional 80.1% |
Demographics Similar to Immigrants from Belgium by In Labor Force | Age 20-64
In terms of in labor force | age 20-64, the demographic groups most similar to Immigrants from Belgium are Immigrants from Switzerland (79.6%, a difference of 0.0%), Slavic (79.6%, a difference of 0.010%), Immigrants from Scotland (79.6%, a difference of 0.010%), Syrian (79.6%, a difference of 0.030%), and Laotian (79.6%, a difference of 0.040%).
| Demographics | Rating | Rank | In Labor Force | Age 20-64 |
| Nigerians | 64.0 /100 | #165 | Good 79.7% |
| Okinawans | 62.7 /100 | #166 | Good 79.6% |
| Immigrants | Iraq | 62.0 /100 | #167 | Good 79.6% |
| Immigrants | Indonesia | 61.8 /100 | #168 | Good 79.6% |
| Laotians | 58.4 /100 | #169 | Average 79.6% |
| Slavs | 54.0 /100 | #170 | Average 79.6% |
| Immigrants | Switzerland | 53.3 /100 | #171 | Average 79.6% |
| Immigrants | Belgium | 53.1 /100 | #172 | Average 79.6% |
| Immigrants | Scotland | 52.4 /100 | #173 | Average 79.6% |
| Syrians | 50.0 /100 | #174 | Average 79.6% |
| Cubans | 46.1 /100 | #175 | Average 79.5% |
| Australians | 46.0 /100 | #176 | Average 79.5% |
| Immigrants | Netherlands | 45.2 /100 | #177 | Average 79.5% |
| Czechoslovakians | 44.3 /100 | #178 | Average 79.5% |
| Armenians | 41.4 /100 | #179 | Average 79.5% |