Eastern European vs South African In Labor Force | Age 20-64
COMPARE
Eastern European
South African
In Labor Force | Age 20-64
In Labor Force | Age 20-64 Comparison
Eastern Europeans
South Africans
80.2%
IN LABOR FORCE | AGE 20-64
98.4/ 100
METRIC RATING
72nd/ 347
METRIC RANK
79.7%
IN LABOR FORCE | AGE 20-64
66.2/ 100
METRIC RATING
161st/ 347
METRIC RANK
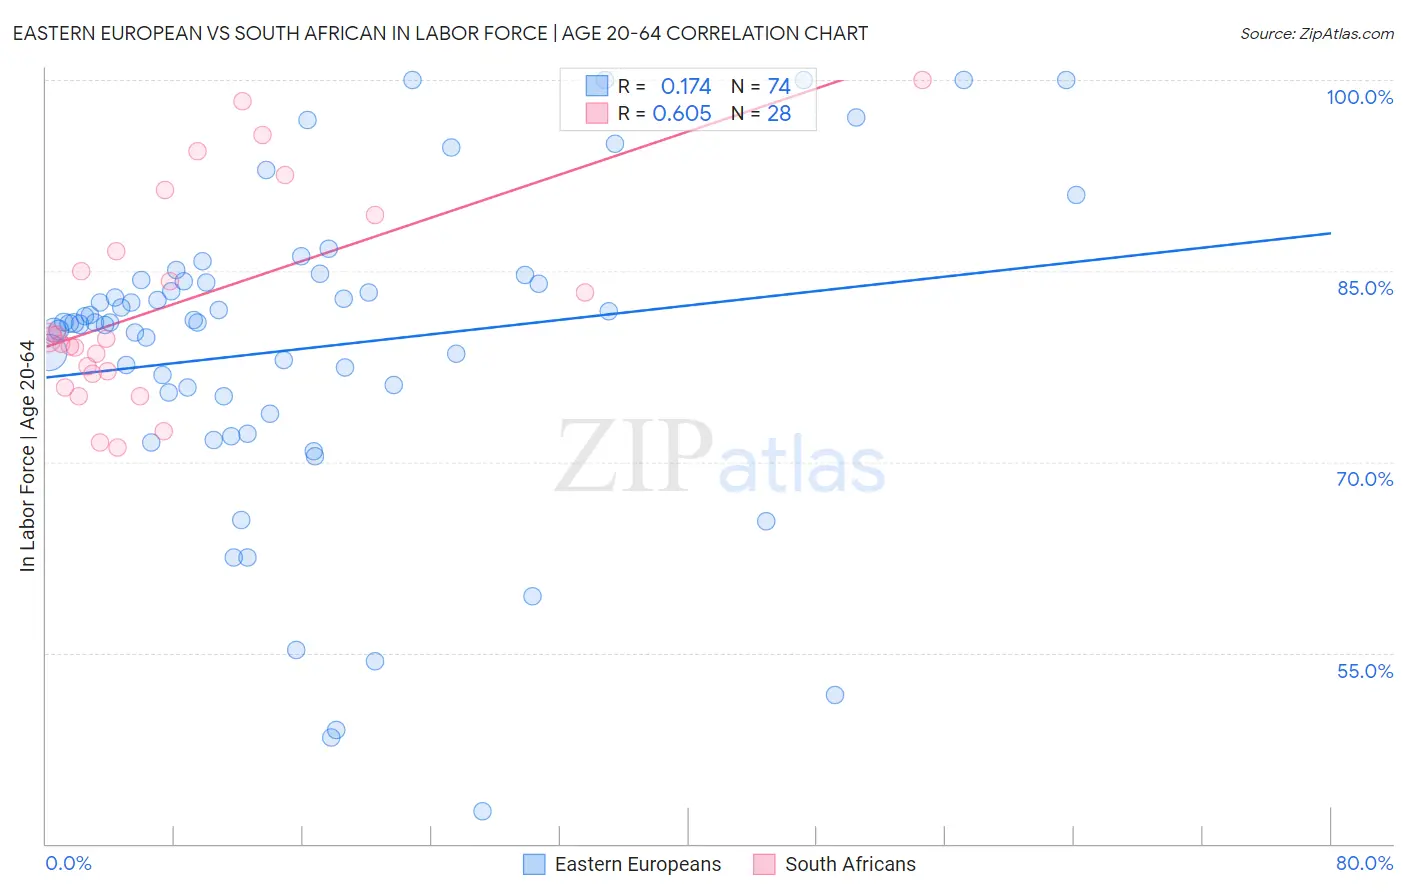
Eastern European vs South African In Labor Force | Age 20-64 Correlation Chart
The statistical analysis conducted on geographies consisting of 461,260,494 people shows a poor positive correlation between the proportion of Eastern Europeans and labor force participation rate among population between the ages 20 and 64 in the United States with a correlation coefficient (R) of 0.174 and weighted average of 80.2%. Similarly, the statistical analysis conducted on geographies consisting of 182,600,467 people shows a significant positive correlation between the proportion of South Africans and labor force participation rate among population between the ages 20 and 64 in the United States with a correlation coefficient (R) of 0.605 and weighted average of 79.7%, a difference of 0.69%.
In Labor Force | Age 20-64 Correlation Summary
| Measurement | Eastern European | South African |
| Minimum | 42.6% | 71.1% |
| Maximum | 100.0% | 100.0% |
| Range | 57.4% | 28.9% |
| Mean | 79.0% | 82.4% |
| Median | 80.9% | 79.7% |
| Interquartile 25% (IQ1) | 75.2% | 77.0% |
| Interquartile 75% (IQ3) | 84.2% | 88.0% |
| Interquartile Range (IQR) | 9.0% | 11.0% |
| Standard Deviation (Sample) | 12.3% | 8.1% |
| Standard Deviation (Population) | 12.2% | 8.0% |
Similar Demographics by In Labor Force | Age 20-64
Demographics Similar to Eastern Europeans by In Labor Force | Age 20-64
In terms of in labor force | age 20-64, the demographic groups most similar to Eastern Europeans are Soviet Union (80.2%, a difference of 0.010%), Bhutanese (80.2%, a difference of 0.020%), Albanian (80.2%, a difference of 0.020%), Immigrants from Turkey (80.2%, a difference of 0.020%), and Macedonian (80.2%, a difference of 0.030%).
| Demographics | Rating | Rank | In Labor Force | Age 20-64 |
| Lithuanians | 98.7 /100 | #65 | Exceptional 80.2% |
| Macedonians | 98.7 /100 | #66 | Exceptional 80.2% |
| Taiwanese | 98.6 /100 | #67 | Exceptional 80.2% |
| Bhutanese | 98.6 /100 | #68 | Exceptional 80.2% |
| Albanians | 98.6 /100 | #69 | Exceptional 80.2% |
| Immigrants | Turkey | 98.5 /100 | #70 | Exceptional 80.2% |
| Soviet Union | 98.5 /100 | #71 | Exceptional 80.2% |
| Eastern Europeans | 98.4 /100 | #72 | Exceptional 80.2% |
| Cypriots | 98.2 /100 | #73 | Exceptional 80.2% |
| Immigrants | Eastern Europe | 98.1 /100 | #74 | Exceptional 80.2% |
| Immigrants | Afghanistan | 97.9 /100 | #75 | Exceptional 80.2% |
| Egyptians | 97.8 /100 | #76 | Exceptional 80.2% |
| Immigrants | Colombia | 97.8 /100 | #77 | Exceptional 80.2% |
| Immigrants | Romania | 97.8 /100 | #78 | Exceptional 80.2% |
| Asians | 97.7 /100 | #79 | Exceptional 80.2% |
Demographics Similar to South Africans by In Labor Force | Age 20-64
In terms of in labor force | age 20-64, the demographic groups most similar to South Africans are Immigrants from Cuba (79.7%, a difference of 0.0%), Moroccan (79.7%, a difference of 0.0%), Austrian (79.7%, a difference of 0.010%), German (79.7%, a difference of 0.010%), and Immigrants from Costa Rica (79.7%, a difference of 0.010%).
| Demographics | Rating | Rank | In Labor Force | Age 20-64 |
| New Zealanders | 69.4 /100 | #154 | Good 79.7% |
| Immigrants | South Africa | 69.2 /100 | #155 | Good 79.7% |
| Senegalese | 69.1 /100 | #156 | Good 79.7% |
| Immigrants | China | 69.1 /100 | #157 | Good 79.7% |
| Austrians | 67.6 /100 | #158 | Good 79.7% |
| Immigrants | Cuba | 66.7 /100 | #159 | Good 79.7% |
| Moroccans | 66.7 /100 | #160 | Good 79.7% |
| South Africans | 66.2 /100 | #161 | Good 79.7% |
| Germans | 65.2 /100 | #162 | Good 79.7% |
| Immigrants | Costa Rica | 64.6 /100 | #163 | Good 79.7% |
| Immigrants | Burma/Myanmar | 64.4 /100 | #164 | Good 79.7% |
| Nigerians | 64.0 /100 | #165 | Good 79.7% |
| Okinawans | 62.7 /100 | #166 | Good 79.6% |
| Immigrants | Iraq | 62.0 /100 | #167 | Good 79.6% |
| Immigrants | Indonesia | 61.8 /100 | #168 | Good 79.6% |