Crow vs Paraguayan In Labor Force | Age 16-19
COMPARE
Crow
Paraguayan
In Labor Force | Age 16-19
In Labor Force | Age 16-19 Comparison
Crow
Paraguayans
38.5%
IN LABOR FORCE | AGE 16-19
98.5/ 100
METRIC RATING
111th/ 347
METRIC RANK
33.8%
IN LABOR FORCE | AGE 16-19
0.3/ 100
METRIC RATING
279th/ 347
METRIC RANK
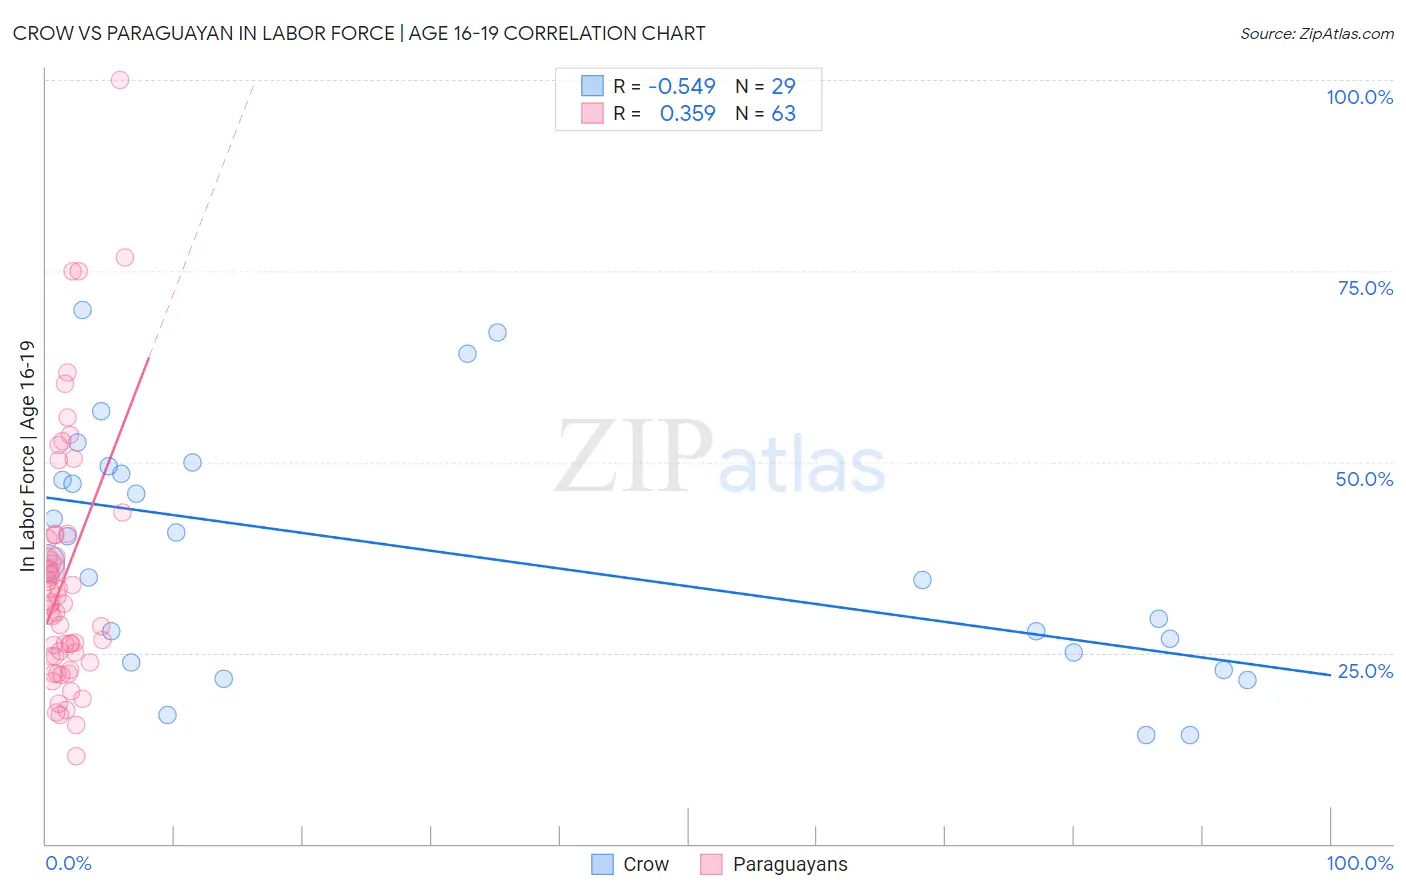
Crow vs Paraguayan In Labor Force | Age 16-19 Correlation Chart
The statistical analysis conducted on geographies consisting of 59,169,003 people shows a substantial negative correlation between the proportion of Crow and labor force participation rate among population between the ages 16 and 19 in the United States with a correlation coefficient (R) of -0.549 and weighted average of 38.5%. Similarly, the statistical analysis conducted on geographies consisting of 95,093,714 people shows a mild positive correlation between the proportion of Paraguayans and labor force participation rate among population between the ages 16 and 19 in the United States with a correlation coefficient (R) of 0.359 and weighted average of 33.8%, a difference of 13.8%.
In Labor Force | Age 16-19 Correlation Summary
| Measurement | Crow | Paraguayan |
| Minimum | 14.3% | 11.4% |
| Maximum | 69.9% | 100.0% |
| Range | 55.6% | 88.6% |
| Mean | 38.0% | 35.2% |
| Median | 36.8% | 31.5% |
| Interquartile 25% (IQ1) | 24.4% | 24.5% |
| Interquartile 75% (IQ3) | 48.9% | 40.5% |
| Interquartile Range (IQR) | 24.6% | 16.0% |
| Standard Deviation (Sample) | 15.7% | 16.8% |
| Standard Deviation (Population) | 15.4% | 16.6% |
Similar Demographics by In Labor Force | Age 16-19
Demographics Similar to Crow by In Labor Force | Age 16-19
In terms of in labor force | age 16-19, the demographic groups most similar to Crow are Immigrants from Scotland (38.5%, a difference of 0.010%), Maltese (38.5%, a difference of 0.060%), Subsaharan African (38.4%, a difference of 0.14%), Immigrants from Ethiopia (38.6%, a difference of 0.18%), and Lebanese (38.6%, a difference of 0.18%).
| Demographics | Rating | Rank | In Labor Force | Age 16-19 |
| Immigrants | Eritrea | 99.0 /100 | #104 | Exceptional 38.7% |
| Iraqis | 98.9 /100 | #105 | Exceptional 38.6% |
| Delaware | 98.8 /100 | #106 | Exceptional 38.6% |
| Chinese | 98.8 /100 | #107 | Exceptional 38.6% |
| Immigrants | Ethiopia | 98.7 /100 | #108 | Exceptional 38.6% |
| Lebanese | 98.7 /100 | #109 | Exceptional 38.6% |
| Maltese | 98.6 /100 | #110 | Exceptional 38.5% |
| Crow | 98.5 /100 | #111 | Exceptional 38.5% |
| Immigrants | Scotland | 98.5 /100 | #112 | Exceptional 38.5% |
| Sub-Saharan Africans | 98.3 /100 | #113 | Exceptional 38.4% |
| Hawaiians | 98.2 /100 | #114 | Exceptional 38.4% |
| Bulgarians | 97.9 /100 | #115 | Exceptional 38.3% |
| Colville | 97.9 /100 | #116 | Exceptional 38.3% |
| Chickasaw | 97.8 /100 | #117 | Exceptional 38.3% |
| Immigrants | Nepal | 97.8 /100 | #118 | Exceptional 38.3% |
Demographics Similar to Paraguayans by In Labor Force | Age 16-19
In terms of in labor force | age 16-19, the demographic groups most similar to Paraguayans are Colombian (33.8%, a difference of 0.010%), Taiwanese (33.8%, a difference of 0.010%), Cypriot (33.8%, a difference of 0.010%), Immigrants from Korea (33.8%, a difference of 0.020%), and Menominee (33.9%, a difference of 0.080%).
| Demographics | Rating | Rank | In Labor Force | Age 16-19 |
| Asians | 0.4 /100 | #272 | Tragic 34.1% |
| Immigrants | Panama | 0.4 /100 | #273 | Tragic 34.0% |
| Venezuelans | 0.3 /100 | #274 | Tragic 34.0% |
| Immigrants | Fiji | 0.3 /100 | #275 | Tragic 33.9% |
| Immigrants | Latin America | 0.3 /100 | #276 | Tragic 33.9% |
| Menominee | 0.3 /100 | #277 | Tragic 33.9% |
| Colombians | 0.3 /100 | #278 | Tragic 33.8% |
| Paraguayans | 0.3 /100 | #279 | Tragic 33.8% |
| Taiwanese | 0.3 /100 | #280 | Tragic 33.8% |
| Cypriots | 0.3 /100 | #281 | Tragic 33.8% |
| Immigrants | Korea | 0.3 /100 | #282 | Tragic 33.8% |
| Immigrants | Venezuela | 0.2 /100 | #283 | Tragic 33.7% |
| Immigrants | Spain | 0.2 /100 | #284 | Tragic 33.7% |
| U.S. Virgin Islanders | 0.2 /100 | #285 | Tragic 33.6% |
| South Americans | 0.2 /100 | #286 | Tragic 33.6% |