Crow vs Immigrants from Eastern Africa In Labor Force | Age 16-19
COMPARE
Crow
Immigrants from Eastern Africa
In Labor Force | Age 16-19
In Labor Force | Age 16-19 Comparison
Crow
Immigrants from Eastern Africa
38.5%
IN LABOR FORCE | AGE 16-19
98.5/ 100
METRIC RATING
111th/ 347
METRIC RANK
40.4%
IN LABOR FORCE | AGE 16-19
100.0/ 100
METRIC RATING
60th/ 347
METRIC RANK
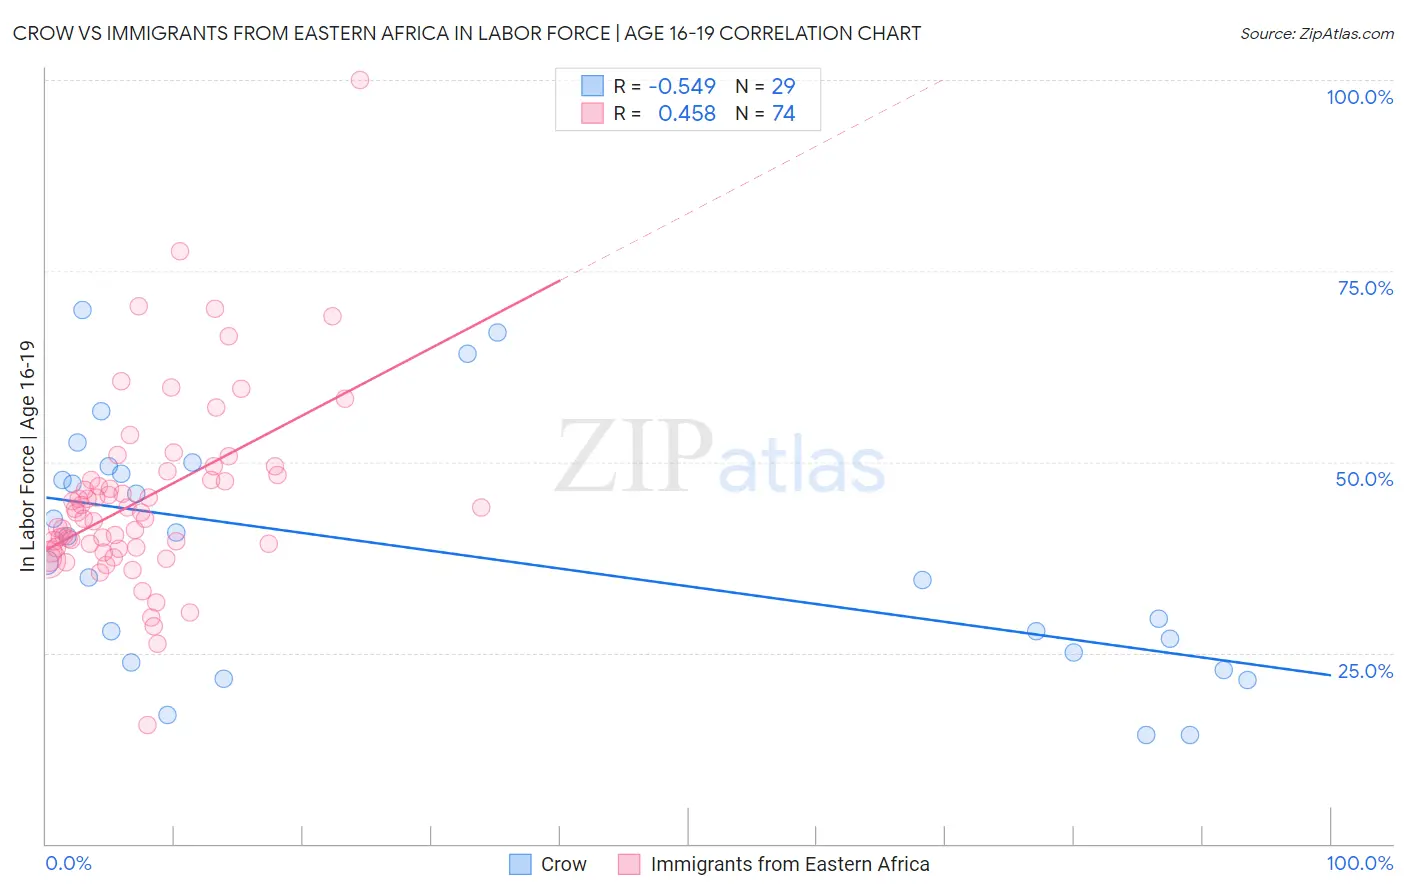
Crow vs Immigrants from Eastern Africa In Labor Force | Age 16-19 Correlation Chart
The statistical analysis conducted on geographies consisting of 59,169,003 people shows a substantial negative correlation between the proportion of Crow and labor force participation rate among population between the ages 16 and 19 in the United States with a correlation coefficient (R) of -0.549 and weighted average of 38.5%. Similarly, the statistical analysis conducted on geographies consisting of 354,925,965 people shows a moderate positive correlation between the proportion of Immigrants from Eastern Africa and labor force participation rate among population between the ages 16 and 19 in the United States with a correlation coefficient (R) of 0.458 and weighted average of 40.4%, a difference of 4.8%.
In Labor Force | Age 16-19 Correlation Summary
| Measurement | Crow | Immigrants from Eastern Africa |
| Minimum | 14.3% | 15.6% |
| Maximum | 69.9% | 100.0% |
| Range | 55.6% | 84.4% |
| Mean | 38.0% | 45.2% |
| Median | 36.8% | 43.4% |
| Interquartile 25% (IQ1) | 24.4% | 38.8% |
| Interquartile 75% (IQ3) | 48.9% | 48.2% |
| Interquartile Range (IQR) | 24.6% | 9.4% |
| Standard Deviation (Sample) | 15.7% | 12.3% |
| Standard Deviation (Population) | 15.4% | 12.2% |
Similar Demographics by In Labor Force | Age 16-19
Demographics Similar to Crow by In Labor Force | Age 16-19
In terms of in labor force | age 16-19, the demographic groups most similar to Crow are Immigrants from Scotland (38.5%, a difference of 0.010%), Maltese (38.5%, a difference of 0.060%), Subsaharan African (38.4%, a difference of 0.14%), Immigrants from Ethiopia (38.6%, a difference of 0.18%), and Lebanese (38.6%, a difference of 0.18%).
| Demographics | Rating | Rank | In Labor Force | Age 16-19 |
| Immigrants | Eritrea | 99.0 /100 | #104 | Exceptional 38.7% |
| Iraqis | 98.9 /100 | #105 | Exceptional 38.6% |
| Delaware | 98.8 /100 | #106 | Exceptional 38.6% |
| Chinese | 98.8 /100 | #107 | Exceptional 38.6% |
| Immigrants | Ethiopia | 98.7 /100 | #108 | Exceptional 38.6% |
| Lebanese | 98.7 /100 | #109 | Exceptional 38.6% |
| Maltese | 98.6 /100 | #110 | Exceptional 38.5% |
| Crow | 98.5 /100 | #111 | Exceptional 38.5% |
| Immigrants | Scotland | 98.5 /100 | #112 | Exceptional 38.5% |
| Sub-Saharan Africans | 98.3 /100 | #113 | Exceptional 38.4% |
| Hawaiians | 98.2 /100 | #114 | Exceptional 38.4% |
| Bulgarians | 97.9 /100 | #115 | Exceptional 38.3% |
| Colville | 97.9 /100 | #116 | Exceptional 38.3% |
| Chickasaw | 97.8 /100 | #117 | Exceptional 38.3% |
| Immigrants | Nepal | 97.8 /100 | #118 | Exceptional 38.3% |
Demographics Similar to Immigrants from Eastern Africa by In Labor Force | Age 16-19
In terms of in labor force | age 16-19, the demographic groups most similar to Immigrants from Eastern Africa are Slavic (40.4%, a difference of 0.040%), American (40.3%, a difference of 0.15%), Aleut (40.4%, a difference of 0.18%), Lithuanian (40.4%, a difference of 0.19%), and Fijian (40.4%, a difference of 0.22%).
| Demographics | Rating | Rank | In Labor Force | Age 16-19 |
| Immigrants | Kenya | 100.0 /100 | #53 | Exceptional 40.5% |
| Tlingit-Haida | 100.0 /100 | #54 | Exceptional 40.5% |
| British | 100.0 /100 | #55 | Exceptional 40.5% |
| Fijians | 100.0 /100 | #56 | Exceptional 40.4% |
| Lithuanians | 100.0 /100 | #57 | Exceptional 40.4% |
| Aleuts | 100.0 /100 | #58 | Exceptional 40.4% |
| Slavs | 100.0 /100 | #59 | Exceptional 40.4% |
| Immigrants | Eastern Africa | 100.0 /100 | #60 | Exceptional 40.4% |
| Americans | 100.0 /100 | #61 | Exceptional 40.3% |
| Cherokee | 100.0 /100 | #62 | Exceptional 40.2% |
| Northern Europeans | 100.0 /100 | #63 | Exceptional 40.2% |
| Immigrants | Micronesia | 100.0 /100 | #64 | Exceptional 40.2% |
| Kenyans | 100.0 /100 | #65 | Exceptional 40.1% |
| Immigrants | Nonimmigrants | 100.0 /100 | #66 | Exceptional 40.1% |
| Canadians | 100.0 /100 | #67 | Exceptional 40.1% |