Crow vs Immigrants from Morocco In Labor Force | Age 16-19
COMPARE
Crow
Immigrants from Morocco
In Labor Force | Age 16-19
In Labor Force | Age 16-19 Comparison
Crow
Immigrants from Morocco
38.5%
IN LABOR FORCE | AGE 16-19
98.5/ 100
METRIC RATING
111th/ 347
METRIC RANK
36.4%
IN LABOR FORCE | AGE 16-19
41.1/ 100
METRIC RATING
180th/ 347
METRIC RANK
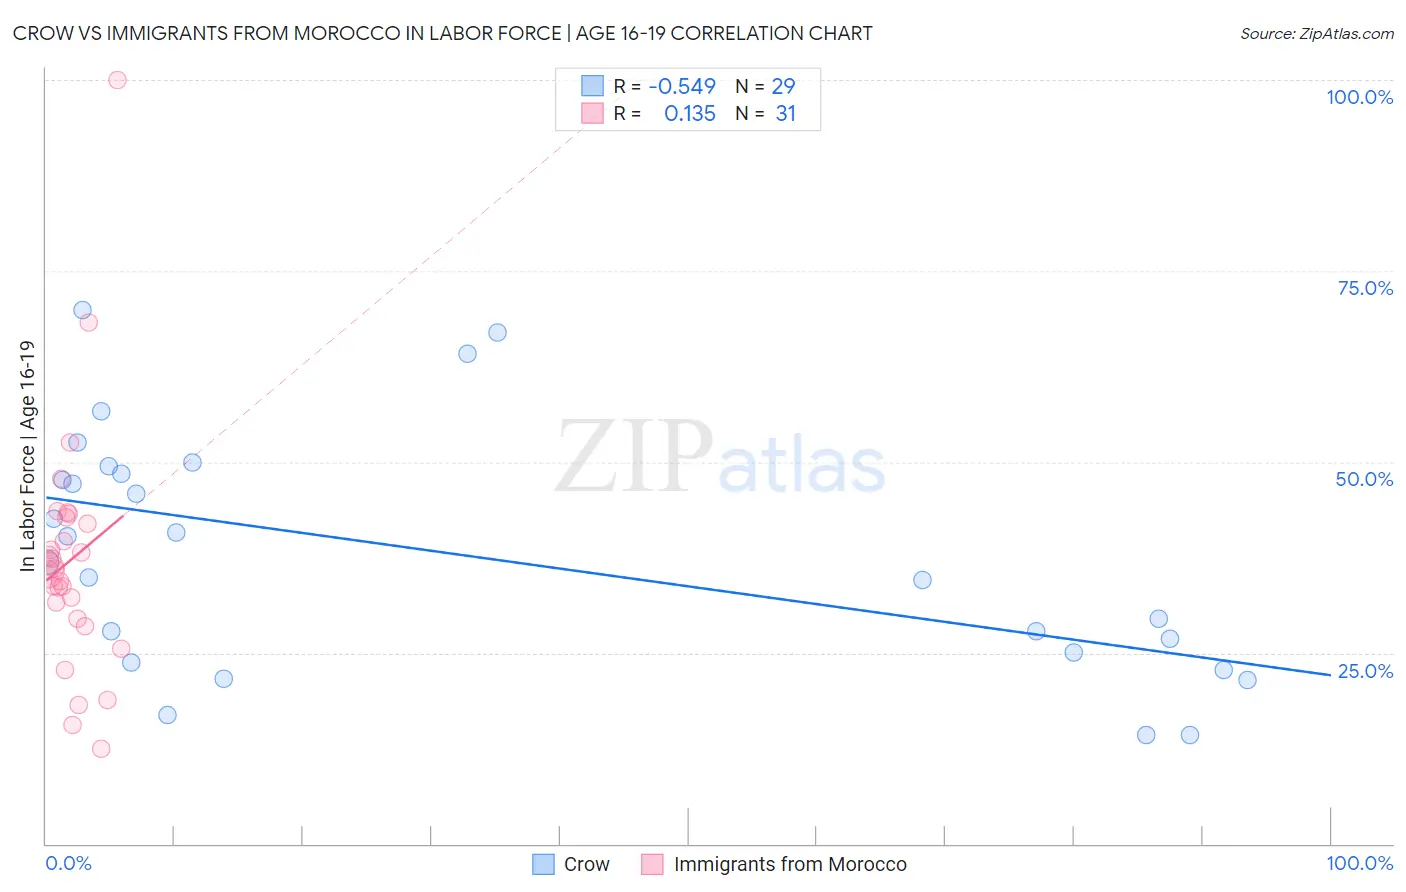
Crow vs Immigrants from Morocco In Labor Force | Age 16-19 Correlation Chart
The statistical analysis conducted on geographies consisting of 59,169,003 people shows a substantial negative correlation between the proportion of Crow and labor force participation rate among population between the ages 16 and 19 in the United States with a correlation coefficient (R) of -0.549 and weighted average of 38.5%. Similarly, the statistical analysis conducted on geographies consisting of 178,800,996 people shows a poor positive correlation between the proportion of Immigrants from Morocco and labor force participation rate among population between the ages 16 and 19 in the United States with a correlation coefficient (R) of 0.135 and weighted average of 36.4%, a difference of 5.8%.
In Labor Force | Age 16-19 Correlation Summary
| Measurement | Crow | Immigrants from Morocco |
| Minimum | 14.3% | 12.5% |
| Maximum | 69.9% | 100.0% |
| Range | 55.6% | 87.5% |
| Mean | 38.0% | 37.2% |
| Median | 36.8% | 35.9% |
| Interquartile 25% (IQ1) | 24.4% | 29.4% |
| Interquartile 75% (IQ3) | 48.9% | 42.6% |
| Interquartile Range (IQR) | 24.6% | 13.2% |
| Standard Deviation (Sample) | 15.7% | 16.1% |
| Standard Deviation (Population) | 15.4% | 15.9% |
Similar Demographics by In Labor Force | Age 16-19
Demographics Similar to Crow by In Labor Force | Age 16-19
In terms of in labor force | age 16-19, the demographic groups most similar to Crow are Immigrants from Scotland (38.5%, a difference of 0.010%), Maltese (38.5%, a difference of 0.060%), Subsaharan African (38.4%, a difference of 0.14%), Immigrants from Ethiopia (38.6%, a difference of 0.18%), and Lebanese (38.6%, a difference of 0.18%).
| Demographics | Rating | Rank | In Labor Force | Age 16-19 |
| Immigrants | Eritrea | 99.0 /100 | #104 | Exceptional 38.7% |
| Iraqis | 98.9 /100 | #105 | Exceptional 38.6% |
| Delaware | 98.8 /100 | #106 | Exceptional 38.6% |
| Chinese | 98.8 /100 | #107 | Exceptional 38.6% |
| Immigrants | Ethiopia | 98.7 /100 | #108 | Exceptional 38.6% |
| Lebanese | 98.7 /100 | #109 | Exceptional 38.6% |
| Maltese | 98.6 /100 | #110 | Exceptional 38.5% |
| Crow | 98.5 /100 | #111 | Exceptional 38.5% |
| Immigrants | Scotland | 98.5 /100 | #112 | Exceptional 38.5% |
| Sub-Saharan Africans | 98.3 /100 | #113 | Exceptional 38.4% |
| Hawaiians | 98.2 /100 | #114 | Exceptional 38.4% |
| Bulgarians | 97.9 /100 | #115 | Exceptional 38.3% |
| Colville | 97.9 /100 | #116 | Exceptional 38.3% |
| Chickasaw | 97.8 /100 | #117 | Exceptional 38.3% |
| Immigrants | Nepal | 97.8 /100 | #118 | Exceptional 38.3% |
Demographics Similar to Immigrants from Morocco by In Labor Force | Age 16-19
In terms of in labor force | age 16-19, the demographic groups most similar to Immigrants from Morocco are Jordanian (36.4%, a difference of 0.080%), Immigrants from Italy (36.4%, a difference of 0.10%), Immigrants from Southern Europe (36.4%, a difference of 0.12%), Eastern European (36.4%, a difference of 0.12%), and Black/African American (36.5%, a difference of 0.21%).
| Demographics | Rating | Rank | In Labor Force | Age 16-19 |
| Russians | 57.5 /100 | #173 | Average 36.7% |
| Immigrants | Czechoslovakia | 50.0 /100 | #174 | Average 36.6% |
| Natives/Alaskans | 49.0 /100 | #175 | Average 36.6% |
| Albanians | 48.8 /100 | #176 | Average 36.5% |
| Immigrants | Northern Europe | 46.6 /100 | #177 | Average 36.5% |
| Blacks/African Americans | 45.1 /100 | #178 | Average 36.5% |
| Immigrants | Southern Europe | 43.3 /100 | #179 | Average 36.4% |
| Immigrants | Morocco | 41.1 /100 | #180 | Average 36.4% |
| Jordanians | 39.6 /100 | #181 | Fair 36.4% |
| Immigrants | Italy | 39.1 /100 | #182 | Fair 36.4% |
| Eastern Europeans | 38.8 /100 | #183 | Fair 36.4% |
| Costa Ricans | 36.1 /100 | #184 | Fair 36.3% |
| Bhutanese | 35.3 /100 | #185 | Fair 36.3% |
| Immigrants | Romania | 34.0 /100 | #186 | Fair 36.3% |
| Immigrants | Afghanistan | 34.0 /100 | #187 | Fair 36.3% |