Ugandan vs Paraguayan In Labor Force | Age 16-19
COMPARE
Ugandan
Paraguayan
In Labor Force | Age 16-19
In Labor Force | Age 16-19 Comparison
Ugandans
Paraguayans
38.9%
IN LABOR FORCE | AGE 16-19
99.3/ 100
METRIC RATING
98th/ 347
METRIC RANK
33.8%
IN LABOR FORCE | AGE 16-19
0.3/ 100
METRIC RATING
279th/ 347
METRIC RANK
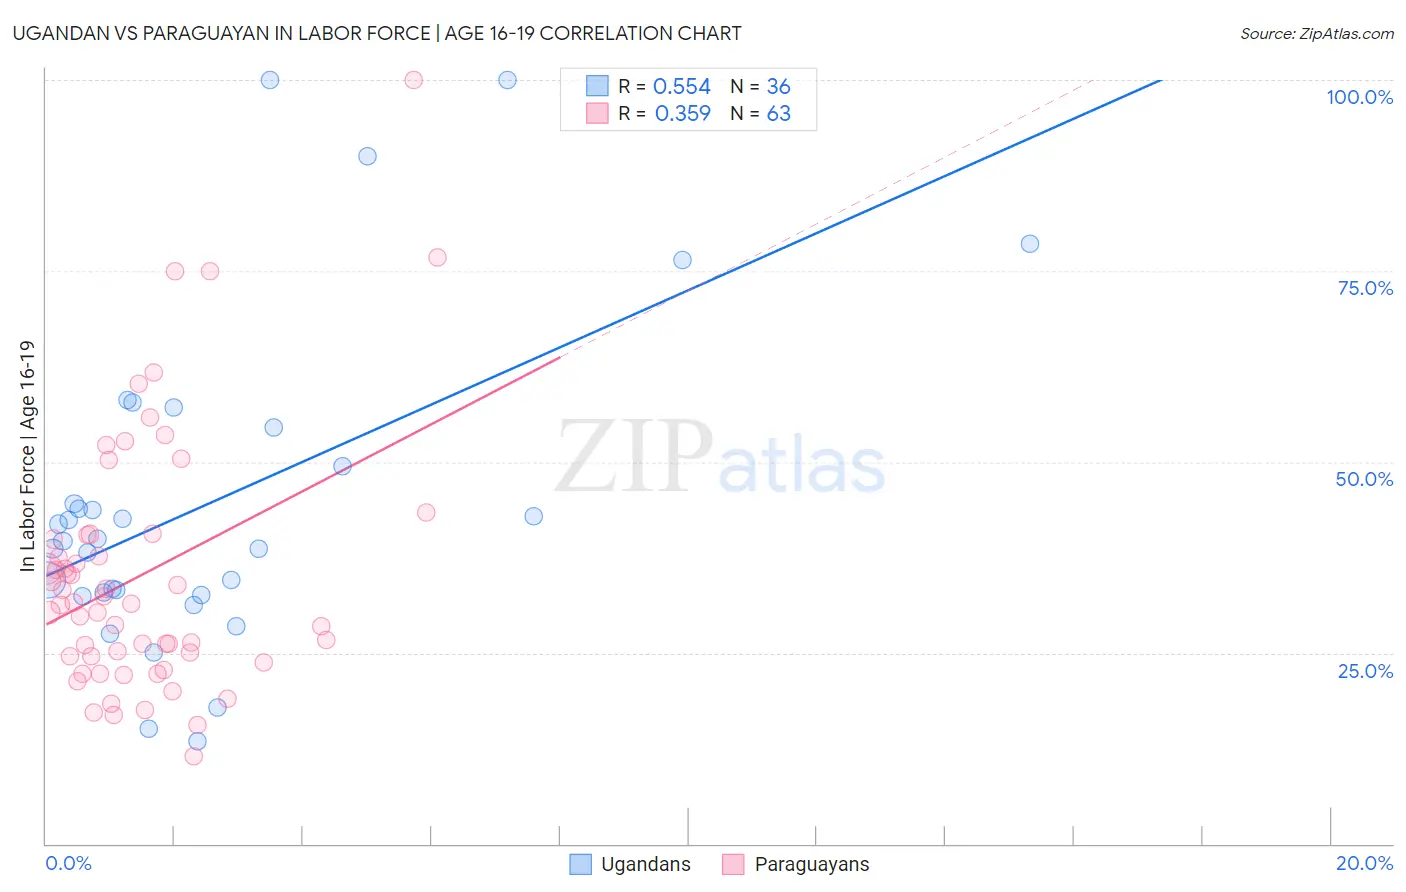
Ugandan vs Paraguayan In Labor Force | Age 16-19 Correlation Chart
The statistical analysis conducted on geographies consisting of 94,006,992 people shows a substantial positive correlation between the proportion of Ugandans and labor force participation rate among population between the ages 16 and 19 in the United States with a correlation coefficient (R) of 0.554 and weighted average of 38.9%. Similarly, the statistical analysis conducted on geographies consisting of 95,093,714 people shows a mild positive correlation between the proportion of Paraguayans and labor force participation rate among population between the ages 16 and 19 in the United States with a correlation coefficient (R) of 0.359 and weighted average of 33.8%, a difference of 14.9%.
In Labor Force | Age 16-19 Correlation Summary
| Measurement | Ugandan | Paraguayan |
| Minimum | 13.5% | 11.4% |
| Maximum | 100.0% | 100.0% |
| Range | 86.5% | 88.6% |
| Mean | 44.8% | 35.2% |
| Median | 39.8% | 31.5% |
| Interquartile 25% (IQ1) | 32.7% | 24.5% |
| Interquartile 75% (IQ3) | 52.0% | 40.5% |
| Interquartile Range (IQR) | 19.3% | 16.0% |
| Standard Deviation (Sample) | 21.2% | 16.8% |
| Standard Deviation (Population) | 20.9% | 16.6% |
Similar Demographics by In Labor Force | Age 16-19
Demographics Similar to Ugandans by In Labor Force | Age 16-19
In terms of in labor force | age 16-19, the demographic groups most similar to Ugandans are Greek (38.9%, a difference of 0.010%), Immigrants from North Macedonia (38.9%, a difference of 0.020%), Latvian (38.9%, a difference of 0.050%), Immigrants from North America (38.9%, a difference of 0.080%), and Blackfeet (38.9%, a difference of 0.17%).
| Demographics | Rating | Rank | In Labor Force | Age 16-19 |
| Spanish Americans | 99.5 /100 | #91 | Exceptional 39.0% |
| Osage | 99.4 /100 | #92 | Exceptional 39.0% |
| Blackfeet | 99.4 /100 | #93 | Exceptional 38.9% |
| Immigrants | Canada | 99.4 /100 | #94 | Exceptional 38.9% |
| Immigrants | North America | 99.4 /100 | #95 | Exceptional 38.9% |
| Latvians | 99.4 /100 | #96 | Exceptional 38.9% |
| Greeks | 99.3 /100 | #97 | Exceptional 38.9% |
| Ugandans | 99.3 /100 | #98 | Exceptional 38.9% |
| Immigrants | North Macedonia | 99.3 /100 | #99 | Exceptional 38.9% |
| Immigrants | Thailand | 99.1 /100 | #100 | Exceptional 38.7% |
| Hmong | 99.1 /100 | #101 | Exceptional 38.7% |
| Zimbabweans | 99.1 /100 | #102 | Exceptional 38.7% |
| Immigrants | Cameroon | 99.0 /100 | #103 | Exceptional 38.7% |
| Immigrants | Eritrea | 99.0 /100 | #104 | Exceptional 38.7% |
| Iraqis | 98.9 /100 | #105 | Exceptional 38.6% |
Demographics Similar to Paraguayans by In Labor Force | Age 16-19
In terms of in labor force | age 16-19, the demographic groups most similar to Paraguayans are Colombian (33.8%, a difference of 0.010%), Taiwanese (33.8%, a difference of 0.010%), Cypriot (33.8%, a difference of 0.010%), Immigrants from Korea (33.8%, a difference of 0.020%), and Menominee (33.9%, a difference of 0.080%).
| Demographics | Rating | Rank | In Labor Force | Age 16-19 |
| Asians | 0.4 /100 | #272 | Tragic 34.1% |
| Immigrants | Panama | 0.4 /100 | #273 | Tragic 34.0% |
| Venezuelans | 0.3 /100 | #274 | Tragic 34.0% |
| Immigrants | Fiji | 0.3 /100 | #275 | Tragic 33.9% |
| Immigrants | Latin America | 0.3 /100 | #276 | Tragic 33.9% |
| Menominee | 0.3 /100 | #277 | Tragic 33.9% |
| Colombians | 0.3 /100 | #278 | Tragic 33.8% |
| Paraguayans | 0.3 /100 | #279 | Tragic 33.8% |
| Taiwanese | 0.3 /100 | #280 | Tragic 33.8% |
| Cypriots | 0.3 /100 | #281 | Tragic 33.8% |
| Immigrants | Korea | 0.3 /100 | #282 | Tragic 33.8% |
| Immigrants | Venezuela | 0.2 /100 | #283 | Tragic 33.7% |
| Immigrants | Spain | 0.2 /100 | #284 | Tragic 33.7% |
| U.S. Virgin Islanders | 0.2 /100 | #285 | Tragic 33.6% |
| South Americans | 0.2 /100 | #286 | Tragic 33.6% |