Crow vs Paraguayan Median Female Earnings
COMPARE
Crow
Paraguayan
Median Female Earnings
Median Female Earnings Comparison
Crow
Paraguayans
$35,266
MEDIAN FEMALE EARNINGS
0.0/ 100
METRIC RATING
304th/ 347
METRIC RANK
$43,173
MEDIAN FEMALE EARNINGS
99.9/ 100
METRIC RATING
58th/ 347
METRIC RANK
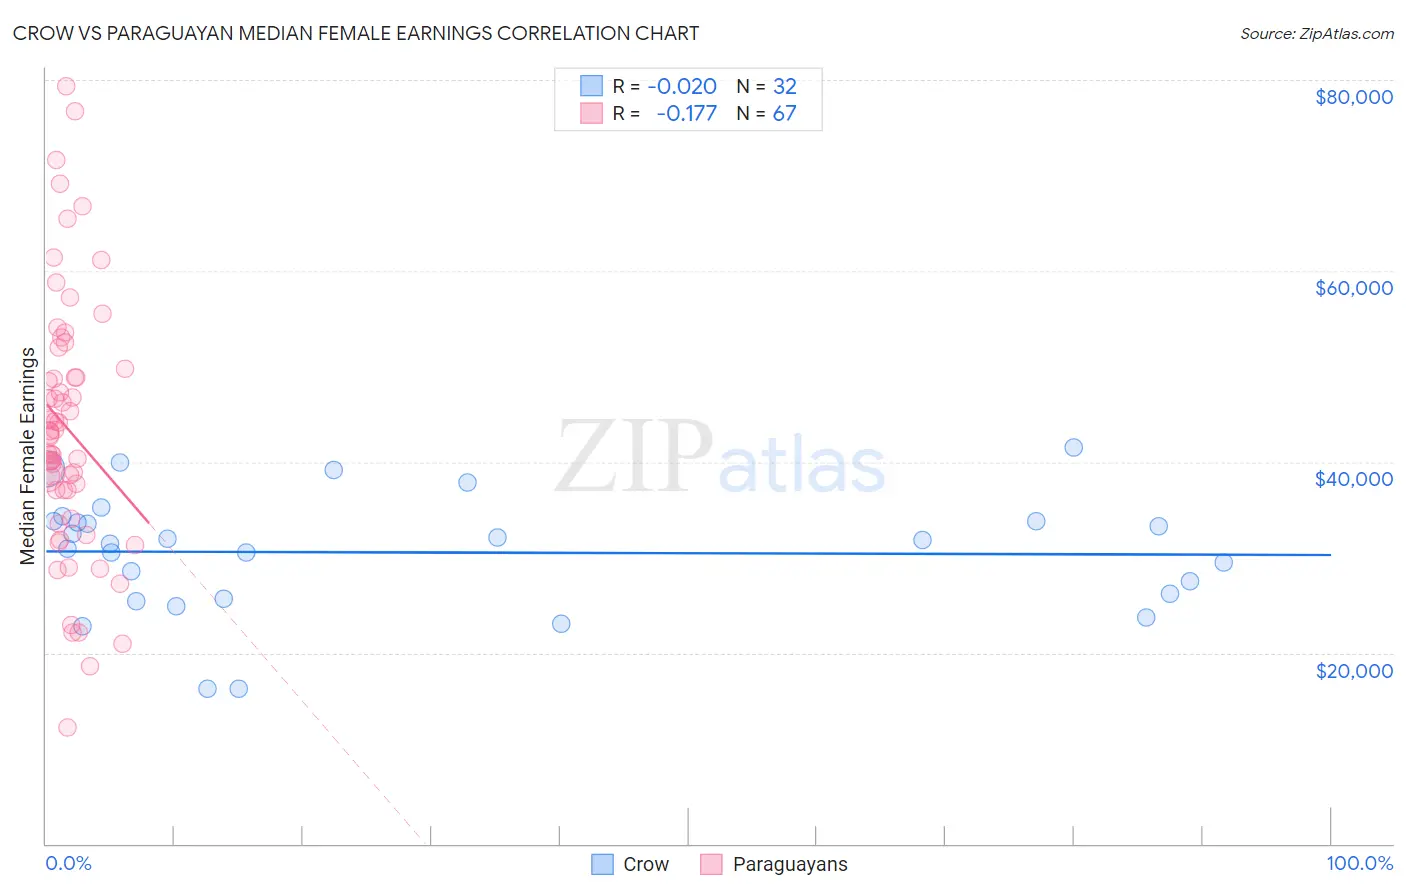
Crow vs Paraguayan Median Female Earnings Correlation Chart
The statistical analysis conducted on geographies consisting of 59,190,197 people shows no correlation between the proportion of Crow and median female earnings in the United States with a correlation coefficient (R) of -0.020 and weighted average of $35,266. Similarly, the statistical analysis conducted on geographies consisting of 95,111,705 people shows a poor negative correlation between the proportion of Paraguayans and median female earnings in the United States with a correlation coefficient (R) of -0.177 and weighted average of $43,173, a difference of 22.4%.
Median Female Earnings Correlation Summary
| Measurement | Crow | Paraguayan |
| Minimum | $16,250 | $12,152 |
| Maximum | $41,563 | $79,410 |
| Range | $25,313 | $67,258 |
| Mean | $30,518 | $43,505 |
| Median | $31,642 | $42,896 |
| Interquartile 25% (IQ1) | $25,950 | $37,010 |
| Interquartile 75% (IQ3) | $33,807 | $49,789 |
| Interquartile Range (IQR) | $7,857 | $12,779 |
| Standard Deviation (Sample) | $6,205 | $13,576 |
| Standard Deviation (Population) | $6,108 | $13,475 |
Similar Demographics by Median Female Earnings
Demographics Similar to Crow by Median Female Earnings
In terms of median female earnings, the demographic groups most similar to Crow are Immigrants from Latin America ($35,307, a difference of 0.11%), Black/African American ($35,315, a difference of 0.14%), Pima ($35,326, a difference of 0.17%), Yuman ($35,377, a difference of 0.31%), and Bahamian ($35,125, a difference of 0.40%).
| Demographics | Rating | Rank | Median Female Earnings |
| Hmong | 0.0 /100 | #297 | Tragic $35,498 |
| Immigrants | Micronesia | 0.0 /100 | #298 | Tragic $35,477 |
| Immigrants | Guatemala | 0.0 /100 | #299 | Tragic $35,444 |
| Yuman | 0.0 /100 | #300 | Tragic $35,377 |
| Pima | 0.0 /100 | #301 | Tragic $35,326 |
| Blacks/African Americans | 0.0 /100 | #302 | Tragic $35,315 |
| Immigrants | Latin America | 0.0 /100 | #303 | Tragic $35,307 |
| Crow | 0.0 /100 | #304 | Tragic $35,266 |
| Bahamians | 0.0 /100 | #305 | Tragic $35,125 |
| Fijians | 0.0 /100 | #306 | Tragic $35,114 |
| Sioux | 0.0 /100 | #307 | Tragic $35,063 |
| Immigrants | Bahamas | 0.0 /100 | #308 | Tragic $35,027 |
| Hondurans | 0.0 /100 | #309 | Tragic $35,013 |
| Chippewa | 0.0 /100 | #310 | Tragic $35,003 |
| Ute | 0.0 /100 | #311 | Tragic $34,960 |
Demographics Similar to Paraguayans by Median Female Earnings
In terms of median female earnings, the demographic groups most similar to Paraguayans are Ethiopian ($43,243, a difference of 0.16%), Estonian ($43,106, a difference of 0.16%), Immigrants from Latvia ($43,099, a difference of 0.17%), Immigrants from Croatia ($43,258, a difference of 0.20%), and Immigrants from Bulgaria ($43,085, a difference of 0.20%).
| Demographics | Rating | Rank | Median Female Earnings |
| Maltese | 100.0 /100 | #51 | Exceptional $43,357 |
| Immigrants | Lithuania | 99.9 /100 | #52 | Exceptional $43,317 |
| Immigrants | Eastern Europe | 99.9 /100 | #53 | Exceptional $43,309 |
| Australians | 99.9 /100 | #54 | Exceptional $43,308 |
| Egyptians | 99.9 /100 | #55 | Exceptional $43,305 |
| Immigrants | Croatia | 99.9 /100 | #56 | Exceptional $43,258 |
| Ethiopians | 99.9 /100 | #57 | Exceptional $43,243 |
| Paraguayans | 99.9 /100 | #58 | Exceptional $43,173 |
| Estonians | 99.9 /100 | #59 | Exceptional $43,106 |
| Immigrants | Latvia | 99.9 /100 | #60 | Exceptional $43,099 |
| Immigrants | Bulgaria | 99.9 /100 | #61 | Exceptional $43,085 |
| Afghans | 99.9 /100 | #62 | Exceptional $43,077 |
| Immigrants | Ukraine | 99.9 /100 | #63 | Exceptional $43,069 |
| Immigrants | Pakistan | 99.9 /100 | #64 | Exceptional $43,052 |
| Sierra Leoneans | 99.9 /100 | #65 | Exceptional $42,868 |