Crow vs Immigrants from Cameroon In Labor Force | Age 16-19
COMPARE
Crow
Immigrants from Cameroon
In Labor Force | Age 16-19
In Labor Force | Age 16-19 Comparison
Crow
Immigrants from Cameroon
38.5%
IN LABOR FORCE | AGE 16-19
98.5/ 100
METRIC RATING
111th/ 347
METRIC RANK
38.7%
IN LABOR FORCE | AGE 16-19
99.0/ 100
METRIC RATING
103rd/ 347
METRIC RANK
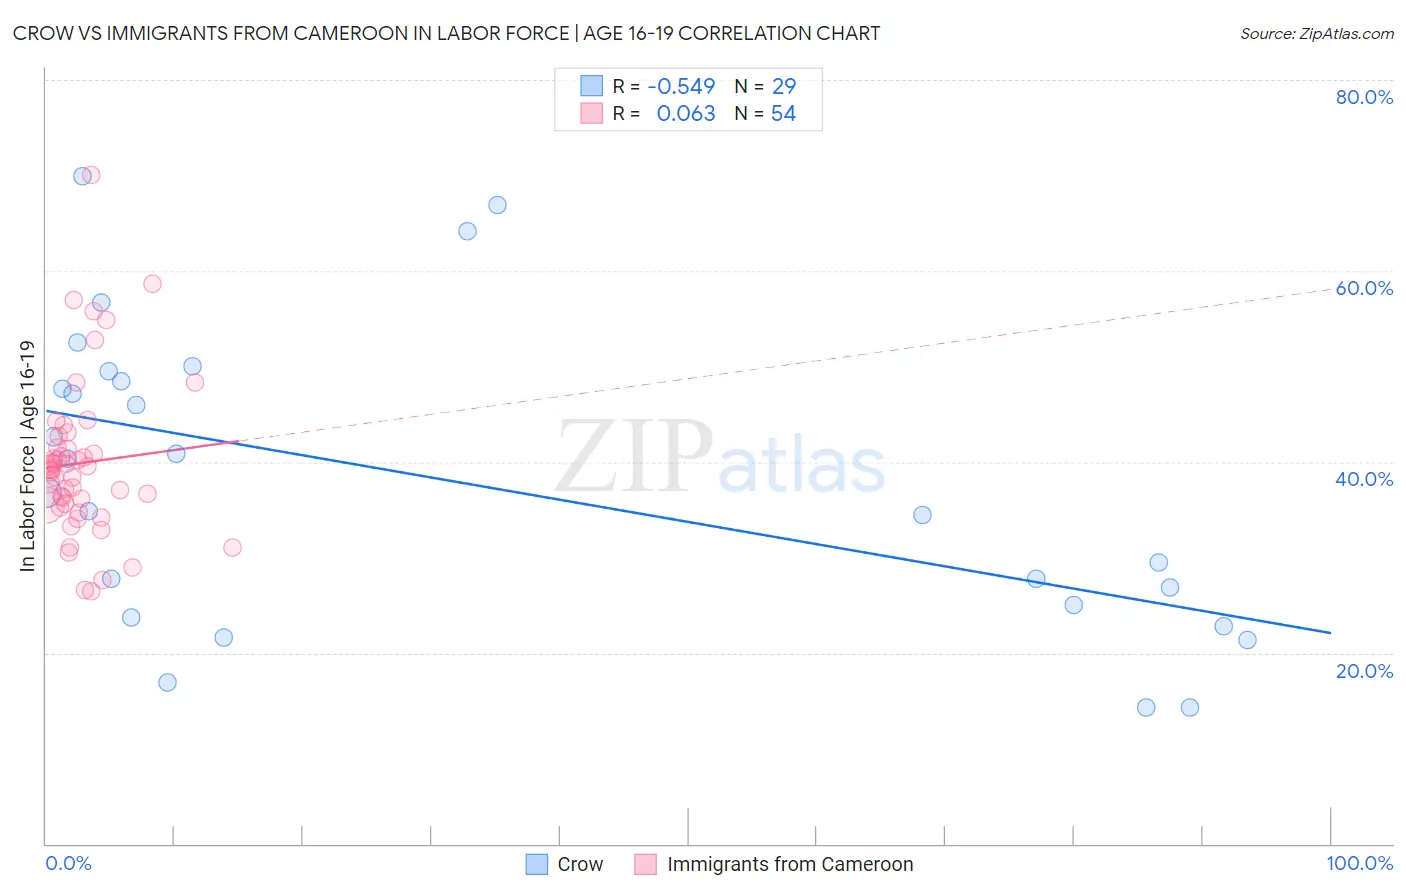
Crow vs Immigrants from Cameroon In Labor Force | Age 16-19 Correlation Chart
The statistical analysis conducted on geographies consisting of 59,169,003 people shows a substantial negative correlation between the proportion of Crow and labor force participation rate among population between the ages 16 and 19 in the United States with a correlation coefficient (R) of -0.549 and weighted average of 38.5%. Similarly, the statistical analysis conducted on geographies consisting of 130,719,565 people shows a slight positive correlation between the proportion of Immigrants from Cameroon and labor force participation rate among population between the ages 16 and 19 in the United States with a correlation coefficient (R) of 0.063 and weighted average of 38.7%, a difference of 0.54%.
In Labor Force | Age 16-19 Correlation Summary
| Measurement | Crow | Immigrants from Cameroon |
| Minimum | 14.3% | 26.5% |
| Maximum | 69.9% | 70.1% |
| Range | 55.6% | 43.6% |
| Mean | 38.0% | 39.9% |
| Median | 36.8% | 39.2% |
| Interquartile 25% (IQ1) | 24.4% | 35.5% |
| Interquartile 75% (IQ3) | 48.9% | 41.6% |
| Interquartile Range (IQR) | 24.6% | 6.1% |
| Standard Deviation (Sample) | 15.7% | 8.3% |
| Standard Deviation (Population) | 15.4% | 8.2% |
Demographics Similar to Crow and Immigrants from Cameroon by In Labor Force | Age 16-19
In terms of in labor force | age 16-19, the demographic groups most similar to Crow are Immigrants from Scotland (38.5%, a difference of 0.010%), Maltese (38.5%, a difference of 0.060%), Subsaharan African (38.4%, a difference of 0.14%), Immigrants from Ethiopia (38.6%, a difference of 0.18%), and Lebanese (38.6%, a difference of 0.18%). Similarly, the demographic groups most similar to Immigrants from Cameroon are Zimbabwean (38.7%, a difference of 0.030%), Hmong (38.7%, a difference of 0.040%), Immigrants from Eritrea (38.7%, a difference of 0.050%), Immigrants from Thailand (38.7%, a difference of 0.11%), and Iraqi (38.6%, a difference of 0.21%).
| Demographics | Rating | Rank | In Labor Force | Age 16-19 |
| Greeks | 99.3 /100 | #97 | Exceptional 38.9% |
| Ugandans | 99.3 /100 | #98 | Exceptional 38.9% |
| Immigrants | North Macedonia | 99.3 /100 | #99 | Exceptional 38.9% |
| Immigrants | Thailand | 99.1 /100 | #100 | Exceptional 38.7% |
| Hmong | 99.1 /100 | #101 | Exceptional 38.7% |
| Zimbabweans | 99.1 /100 | #102 | Exceptional 38.7% |
| Immigrants | Cameroon | 99.0 /100 | #103 | Exceptional 38.7% |
| Immigrants | Eritrea | 99.0 /100 | #104 | Exceptional 38.7% |
| Iraqis | 98.9 /100 | #105 | Exceptional 38.6% |
| Delaware | 98.8 /100 | #106 | Exceptional 38.6% |
| Chinese | 98.8 /100 | #107 | Exceptional 38.6% |
| Immigrants | Ethiopia | 98.7 /100 | #108 | Exceptional 38.6% |
| Lebanese | 98.7 /100 | #109 | Exceptional 38.6% |
| Maltese | 98.6 /100 | #110 | Exceptional 38.5% |
| Crow | 98.5 /100 | #111 | Exceptional 38.5% |
| Immigrants | Scotland | 98.5 /100 | #112 | Exceptional 38.5% |
| Sub-Saharan Africans | 98.3 /100 | #113 | Exceptional 38.4% |
| Hawaiians | 98.2 /100 | #114 | Exceptional 38.4% |
| Bulgarians | 97.9 /100 | #115 | Exceptional 38.3% |
| Colville | 97.9 /100 | #116 | Exceptional 38.3% |
| Chickasaw | 97.8 /100 | #117 | Exceptional 38.3% |