Mongolian vs Paraguayan In Labor Force | Age 16-19
COMPARE
Mongolian
Paraguayan
In Labor Force | Age 16-19
In Labor Force | Age 16-19 Comparison
Mongolians
Paraguayans
35.3%
IN LABOR FORCE | AGE 16-19
5.7/ 100
METRIC RATING
227th/ 347
METRIC RANK
33.8%
IN LABOR FORCE | AGE 16-19
0.3/ 100
METRIC RATING
279th/ 347
METRIC RANK
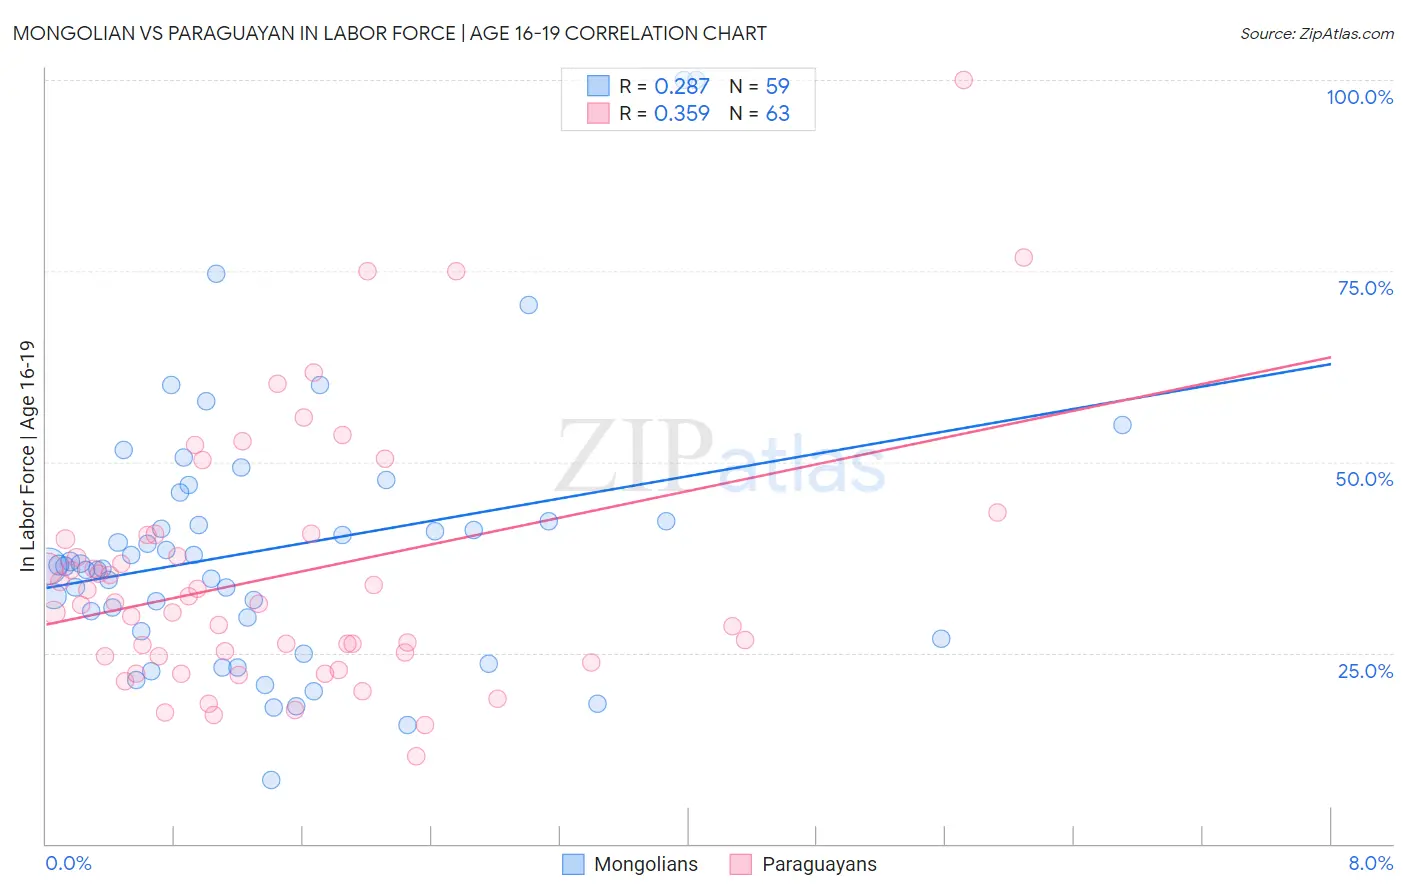
Mongolian vs Paraguayan In Labor Force | Age 16-19 Correlation Chart
The statistical analysis conducted on geographies consisting of 140,345,007 people shows a weak positive correlation between the proportion of Mongolians and labor force participation rate among population between the ages 16 and 19 in the United States with a correlation coefficient (R) of 0.287 and weighted average of 35.3%. Similarly, the statistical analysis conducted on geographies consisting of 95,093,714 people shows a mild positive correlation between the proportion of Paraguayans and labor force participation rate among population between the ages 16 and 19 in the United States with a correlation coefficient (R) of 0.359 and weighted average of 33.8%, a difference of 4.3%.
In Labor Force | Age 16-19 Correlation Summary
| Measurement | Mongolian | Paraguayan |
| Minimum | 8.3% | 11.4% |
| Maximum | 100.0% | 100.0% |
| Range | 91.7% | 88.6% |
| Mean | 38.6% | 35.2% |
| Median | 36.4% | 31.5% |
| Interquartile 25% (IQ1) | 27.9% | 24.5% |
| Interquartile 75% (IQ3) | 42.3% | 40.5% |
| Interquartile Range (IQR) | 14.4% | 16.0% |
| Standard Deviation (Sample) | 17.5% | 16.8% |
| Standard Deviation (Population) | 17.3% | 16.6% |
Similar Demographics by In Labor Force | Age 16-19
Demographics Similar to Mongolians by In Labor Force | Age 16-19
In terms of in labor force | age 16-19, the demographic groups most similar to Mongolians are Immigrants from Guatemala (35.3%, a difference of 0.010%), Immigrants from Senegal (35.3%, a difference of 0.050%), Immigrants from Belgium (35.3%, a difference of 0.10%), Honduran (35.3%, a difference of 0.18%), and Immigrants from Lebanon (35.2%, a difference of 0.18%).
| Demographics | Rating | Rank | In Labor Force | Age 16-19 |
| Immigrants | Bahamas | 8.3 /100 | #220 | Tragic 35.5% |
| Turks | 7.3 /100 | #221 | Tragic 35.4% |
| Immigrants | Ghana | 7.3 /100 | #222 | Tragic 35.4% |
| Ghanaians | 6.5 /100 | #223 | Tragic 35.3% |
| Hondurans | 6.5 /100 | #224 | Tragic 35.3% |
| Immigrants | Belgium | 6.1 /100 | #225 | Tragic 35.3% |
| Immigrants | Guatemala | 5.7 /100 | #226 | Tragic 35.3% |
| Mongolians | 5.7 /100 | #227 | Tragic 35.3% |
| Immigrants | Senegal | 5.5 /100 | #228 | Tragic 35.3% |
| Immigrants | Lebanon | 5.0 /100 | #229 | Tragic 35.2% |
| Immigrants | Honduras | 4.9 /100 | #230 | Tragic 35.2% |
| Immigrants | Syria | 4.5 /100 | #231 | Tragic 35.2% |
| Immigrants | Kazakhstan | 4.5 /100 | #232 | Tragic 35.2% |
| Immigrants | France | 4.3 /100 | #233 | Tragic 35.1% |
| Immigrants | Mexico | 4.2 /100 | #234 | Tragic 35.1% |
Demographics Similar to Paraguayans by In Labor Force | Age 16-19
In terms of in labor force | age 16-19, the demographic groups most similar to Paraguayans are Colombian (33.8%, a difference of 0.010%), Taiwanese (33.8%, a difference of 0.010%), Cypriot (33.8%, a difference of 0.010%), Immigrants from Korea (33.8%, a difference of 0.020%), and Menominee (33.9%, a difference of 0.080%).
| Demographics | Rating | Rank | In Labor Force | Age 16-19 |
| Asians | 0.4 /100 | #272 | Tragic 34.1% |
| Immigrants | Panama | 0.4 /100 | #273 | Tragic 34.0% |
| Venezuelans | 0.3 /100 | #274 | Tragic 34.0% |
| Immigrants | Fiji | 0.3 /100 | #275 | Tragic 33.9% |
| Immigrants | Latin America | 0.3 /100 | #276 | Tragic 33.9% |
| Menominee | 0.3 /100 | #277 | Tragic 33.9% |
| Colombians | 0.3 /100 | #278 | Tragic 33.8% |
| Paraguayans | 0.3 /100 | #279 | Tragic 33.8% |
| Taiwanese | 0.3 /100 | #280 | Tragic 33.8% |
| Cypriots | 0.3 /100 | #281 | Tragic 33.8% |
| Immigrants | Korea | 0.3 /100 | #282 | Tragic 33.8% |
| Immigrants | Venezuela | 0.2 /100 | #283 | Tragic 33.7% |
| Immigrants | Spain | 0.2 /100 | #284 | Tragic 33.7% |
| U.S. Virgin Islanders | 0.2 /100 | #285 | Tragic 33.6% |
| South Americans | 0.2 /100 | #286 | Tragic 33.6% |