Costa Rican vs Ecuadorian In Labor Force | Age 30-34
COMPARE
Costa Rican
Ecuadorian
In Labor Force | Age 30-34
In Labor Force | Age 30-34 Comparison
Costa Ricans
Ecuadorians
84.6%
IN LABOR FORCE | AGE 30-34
29.6/ 100
METRIC RATING
187th/ 347
METRIC RANK
84.4%
IN LABOR FORCE | AGE 30-34
14.2/ 100
METRIC RATING
204th/ 347
METRIC RANK
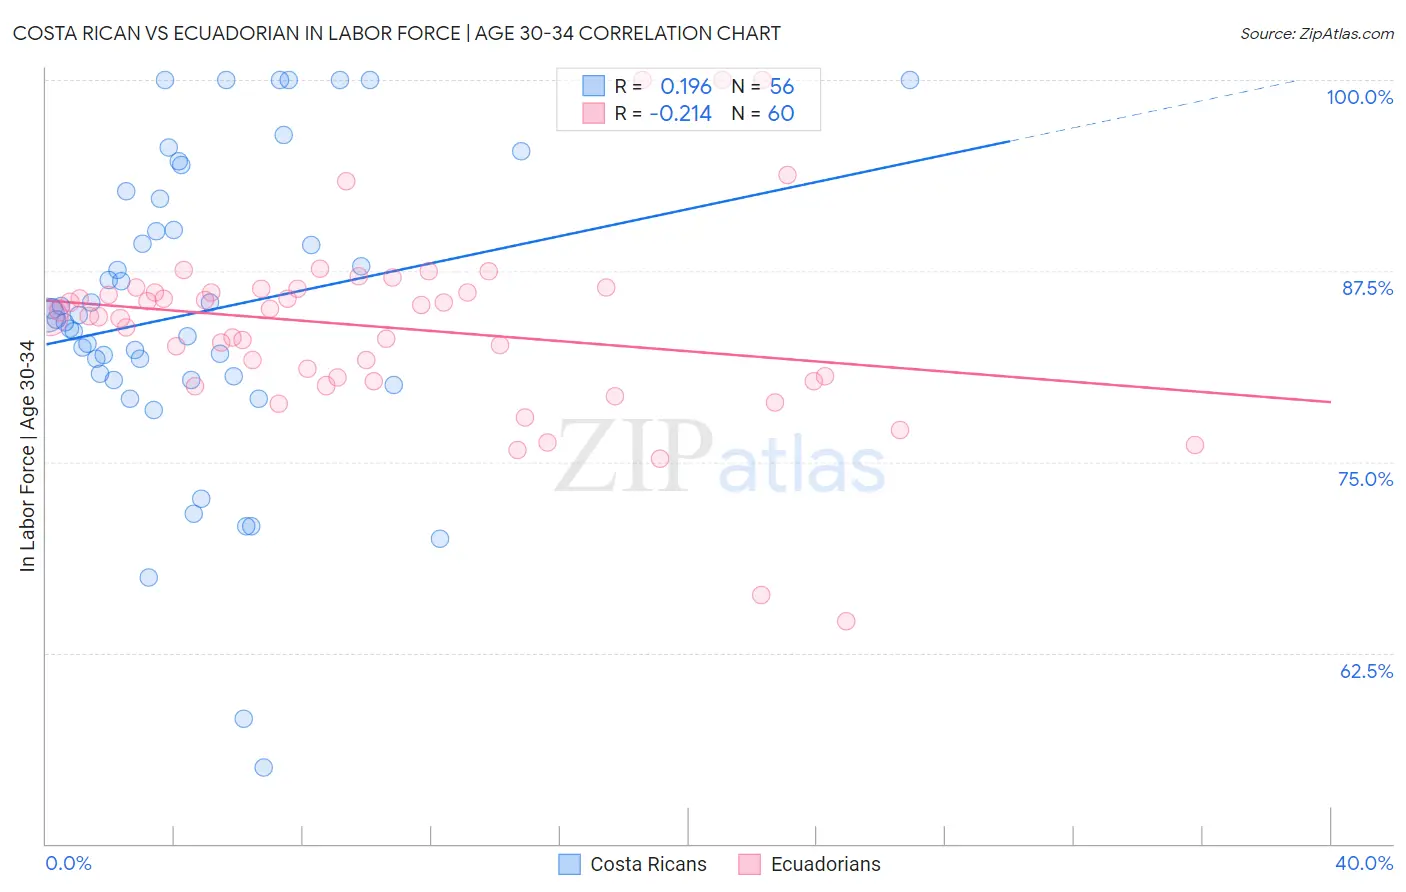
Costa Rican vs Ecuadorian In Labor Force | Age 30-34 Correlation Chart
The statistical analysis conducted on geographies consisting of 253,513,435 people shows a poor positive correlation between the proportion of Costa Ricans and labor force participation rate among population between the ages 30 and 34 in the United States with a correlation coefficient (R) of 0.196 and weighted average of 84.6%. Similarly, the statistical analysis conducted on geographies consisting of 317,665,283 people shows a weak negative correlation between the proportion of Ecuadorians and labor force participation rate among population between the ages 30 and 34 in the United States with a correlation coefficient (R) of -0.214 and weighted average of 84.4%, a difference of 0.16%.
In Labor Force | Age 30-34 Correlation Summary
| Measurement | Costa Rican | Ecuadorian |
| Minimum | 55.0% | 64.6% |
| Maximum | 100.0% | 100.0% |
| Range | 45.0% | 35.4% |
| Mean | 84.8% | 83.8% |
| Median | 84.4% | 84.5% |
| Interquartile 25% (IQ1) | 80.5% | 80.4% |
| Interquartile 75% (IQ3) | 91.2% | 86.2% |
| Interquartile Range (IQR) | 10.7% | 5.8% |
| Standard Deviation (Sample) | 10.0% | 6.3% |
| Standard Deviation (Population) | 9.9% | 6.2% |
Demographics Similar to Costa Ricans and Ecuadorians by In Labor Force | Age 30-34
In terms of in labor force | age 30-34, the demographic groups most similar to Costa Ricans are Immigrants from Congo (84.6%, a difference of 0.0%), Taiwanese (84.6%, a difference of 0.0%), Nigerian (84.5%, a difference of 0.010%), Immigrants from Philippines (84.6%, a difference of 0.020%), and Immigrants from Zaire (84.5%, a difference of 0.030%). Similarly, the demographic groups most similar to Ecuadorians are French (84.4%, a difference of 0.010%), Canadian (84.4%, a difference of 0.020%), Trinidadian and Tobagonian (84.5%, a difference of 0.050%), Immigrants from West Indies (84.5%, a difference of 0.050%), and Immigrants from Thailand (84.5%, a difference of 0.060%).
| Demographics | Rating | Rank | In Labor Force | Age 30-34 |
| Immigrants | Philippines | 31.5 /100 | #185 | Fair 84.6% |
| Immigrants | Congo | 29.7 /100 | #186 | Fair 84.6% |
| Costa Ricans | 29.6 /100 | #187 | Fair 84.6% |
| Taiwanese | 29.4 /100 | #188 | Fair 84.6% |
| Nigerians | 28.9 /100 | #189 | Fair 84.5% |
| Immigrants | Zaire | 25.8 /100 | #190 | Fair 84.5% |
| Hungarians | 24.8 /100 | #191 | Fair 84.5% |
| Scandinavians | 24.7 /100 | #192 | Fair 84.5% |
| Immigrants | Costa Rica | 23.9 /100 | #193 | Fair 84.5% |
| Immigrants | Afghanistan | 23.5 /100 | #194 | Fair 84.5% |
| Koreans | 23.2 /100 | #195 | Fair 84.5% |
| British | 22.9 /100 | #196 | Fair 84.5% |
| Immigrants | Syria | 21.9 /100 | #197 | Fair 84.5% |
| Dutch | 20.2 /100 | #198 | Fair 84.5% |
| Immigrants | Thailand | 19.1 /100 | #199 | Poor 84.5% |
| Sub-Saharan Africans | 19.0 /100 | #200 | Poor 84.5% |
| Trinidadians and Tobagonians | 18.2 /100 | #201 | Poor 84.5% |
| Immigrants | West Indies | 18.1 /100 | #202 | Poor 84.5% |
| Canadians | 15.4 /100 | #203 | Poor 84.4% |
| Ecuadorians | 14.2 /100 | #204 | Poor 84.4% |
| French | 13.8 /100 | #205 | Poor 84.4% |