Immigrants from Haiti vs Ecuadorian In Labor Force | Age 30-34
COMPARE
Immigrants from Haiti
Ecuadorian
In Labor Force | Age 30-34
In Labor Force | Age 30-34 Comparison
Immigrants from Haiti
Ecuadorians
84.2%
IN LABOR FORCE | AGE 30-34
2.8/ 100
METRIC RATING
228th/ 347
METRIC RANK
84.4%
IN LABOR FORCE | AGE 30-34
14.2/ 100
METRIC RATING
204th/ 347
METRIC RANK
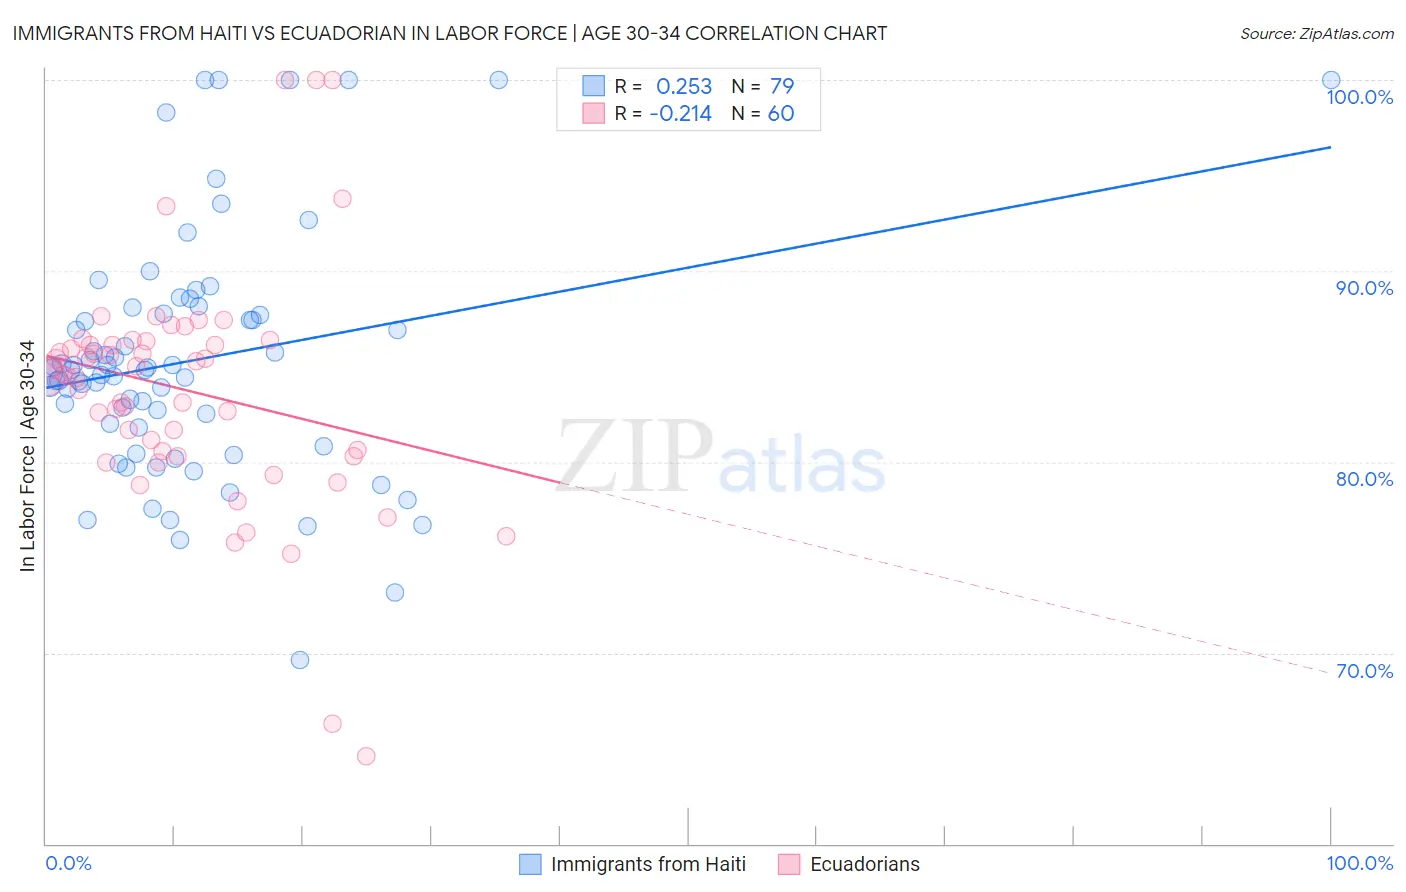
Immigrants from Haiti vs Ecuadorian In Labor Force | Age 30-34 Correlation Chart
The statistical analysis conducted on geographies consisting of 225,211,020 people shows a weak positive correlation between the proportion of Immigrants from Haiti and labor force participation rate among population between the ages 30 and 34 in the United States with a correlation coefficient (R) of 0.253 and weighted average of 84.2%. Similarly, the statistical analysis conducted on geographies consisting of 317,665,283 people shows a weak negative correlation between the proportion of Ecuadorians and labor force participation rate among population between the ages 30 and 34 in the United States with a correlation coefficient (R) of -0.214 and weighted average of 84.4%, a difference of 0.31%.
In Labor Force | Age 30-34 Correlation Summary
| Measurement | Immigrants from Haiti | Ecuadorian |
| Minimum | 69.6% | 64.6% |
| Maximum | 100.0% | 100.0% |
| Range | 30.4% | 35.4% |
| Mean | 85.3% | 83.8% |
| Median | 84.8% | 84.5% |
| Interquartile 25% (IQ1) | 81.8% | 80.4% |
| Interquartile 75% (IQ3) | 87.8% | 86.2% |
| Interquartile Range (IQR) | 6.0% | 5.8% |
| Standard Deviation (Sample) | 6.3% | 6.3% |
| Standard Deviation (Population) | 6.3% | 6.2% |
Similar Demographics by In Labor Force | Age 30-34
Demographics Similar to Immigrants from Haiti by In Labor Force | Age 30-34
In terms of in labor force | age 30-34, the demographic groups most similar to Immigrants from Haiti are Scottish (84.2%, a difference of 0.010%), Immigrants from El Salvador (84.2%, a difference of 0.010%), Immigrants from Cuba (84.2%, a difference of 0.010%), Welsh (84.2%, a difference of 0.010%), and Immigrants from Bahamas (84.1%, a difference of 0.020%).
| Demographics | Rating | Rank | In Labor Force | Age 30-34 |
| Salvadorans | 3.8 /100 | #221 | Tragic 84.2% |
| Panamanians | 3.8 /100 | #222 | Tragic 84.2% |
| Immigrants | Laos | 3.6 /100 | #223 | Tragic 84.2% |
| Cubans | 3.4 /100 | #224 | Tragic 84.2% |
| Scottish | 3.1 /100 | #225 | Tragic 84.2% |
| Immigrants | El Salvador | 3.0 /100 | #226 | Tragic 84.2% |
| Immigrants | Cuba | 3.0 /100 | #227 | Tragic 84.2% |
| Immigrants | Haiti | 2.8 /100 | #228 | Tragic 84.2% |
| Welsh | 2.7 /100 | #229 | Tragic 84.2% |
| Immigrants | Bahamas | 2.6 /100 | #230 | Tragic 84.1% |
| Malaysians | 2.2 /100 | #231 | Tragic 84.1% |
| Immigrants | Immigrants | 2.0 /100 | #232 | Tragic 84.1% |
| West Indians | 1.9 /100 | #233 | Tragic 84.1% |
| Haitians | 1.8 /100 | #234 | Tragic 84.1% |
| French American Indians | 1.7 /100 | #235 | Tragic 84.1% |
Demographics Similar to Ecuadorians by In Labor Force | Age 30-34
In terms of in labor force | age 30-34, the demographic groups most similar to Ecuadorians are French (84.4%, a difference of 0.010%), Canadian (84.4%, a difference of 0.020%), Trinidadian and Tobagonian (84.5%, a difference of 0.050%), Immigrants from West Indies (84.5%, a difference of 0.050%), and Immigrants from Thailand (84.5%, a difference of 0.060%).
| Demographics | Rating | Rank | In Labor Force | Age 30-34 |
| Immigrants | Syria | 21.9 /100 | #197 | Fair 84.5% |
| Dutch | 20.2 /100 | #198 | Fair 84.5% |
| Immigrants | Thailand | 19.1 /100 | #199 | Poor 84.5% |
| Sub-Saharan Africans | 19.0 /100 | #200 | Poor 84.5% |
| Trinidadians and Tobagonians | 18.2 /100 | #201 | Poor 84.5% |
| Immigrants | West Indies | 18.1 /100 | #202 | Poor 84.5% |
| Canadians | 15.4 /100 | #203 | Poor 84.4% |
| Ecuadorians | 14.2 /100 | #204 | Poor 84.4% |
| French | 13.8 /100 | #205 | Poor 84.4% |
| Lebanese | 10.6 /100 | #206 | Poor 84.4% |
| Bangladeshis | 9.4 /100 | #207 | Tragic 84.3% |
| Arabs | 8.9 /100 | #208 | Tragic 84.3% |
| Jamaicans | 8.8 /100 | #209 | Tragic 84.3% |
| Indonesians | 8.8 /100 | #210 | Tragic 84.3% |
| Japanese | 8.8 /100 | #211 | Tragic 84.3% |