Creek vs Ute In Labor Force | Age 45-54
COMPARE
Creek
Ute
In Labor Force | Age 45-54
In Labor Force | Age 45-54 Comparison
Creek
Ute
77.7%
IN LABOR FORCE | AGE 45-54
0.0/ 100
METRIC RATING
329th/ 347
METRIC RANK
76.6%
IN LABOR FORCE | AGE 45-54
0.0/ 100
METRIC RATING
337th/ 347
METRIC RANK
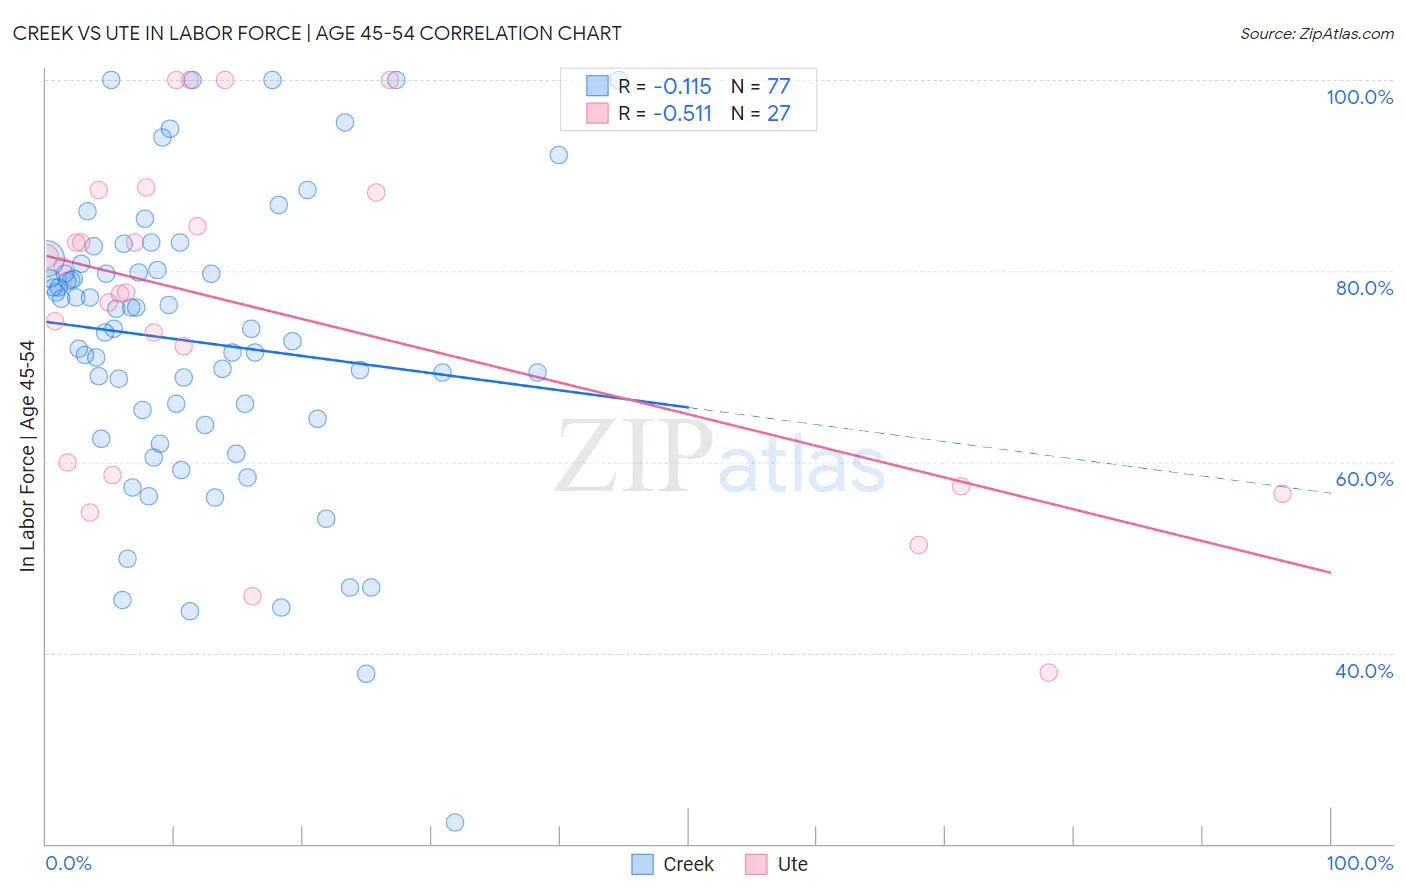
Creek vs Ute In Labor Force | Age 45-54 Correlation Chart
The statistical analysis conducted on geographies consisting of 178,432,423 people shows a poor negative correlation between the proportion of Creek and labor force participation rate among population between the ages 45 and 54 in the United States with a correlation coefficient (R) of -0.115 and weighted average of 77.7%. Similarly, the statistical analysis conducted on geographies consisting of 55,657,904 people shows a substantial negative correlation between the proportion of Ute and labor force participation rate among population between the ages 45 and 54 in the United States with a correlation coefficient (R) of -0.511 and weighted average of 76.6%, a difference of 1.4%.
In Labor Force | Age 45-54 Correlation Summary
| Measurement | Creek | Ute |
| Minimum | 22.2% | 38.0% |
| Maximum | 100.0% | 100.0% |
| Range | 77.8% | 62.0% |
| Mean | 72.6% | 75.4% |
| Median | 74.0% | 77.8% |
| Interquartile 25% (IQ1) | 64.2% | 58.6% |
| Interquartile 75% (IQ3) | 80.4% | 88.2% |
| Interquartile Range (IQR) | 16.2% | 29.6% |
| Standard Deviation (Sample) | 15.3% | 17.3% |
| Standard Deviation (Population) | 15.2% | 16.9% |
Demographics Similar to Creek and Ute by In Labor Force | Age 45-54
In terms of in labor force | age 45-54, the demographic groups most similar to Creek are Cheyenne (77.6%, a difference of 0.22%), Sioux (78.0%, a difference of 0.29%), Tsimshian (77.4%, a difference of 0.37%), Menominee (77.4%, a difference of 0.41%), and Cajun (78.1%, a difference of 0.51%). Similarly, the demographic groups most similar to Ute are Paiute (76.7%, a difference of 0.060%), Yuman (76.3%, a difference of 0.41%), Arapaho (77.1%, a difference of 0.60%), Native/Alaskan (77.1%, a difference of 0.67%), and Apache (77.1%, a difference of 0.67%).
| Demographics | Rating | Rank | In Labor Force | Age 45-54 |
| Kiowa | 0.0 /100 | #323 | Tragic 78.3% |
| Dutch West Indians | 0.0 /100 | #324 | Tragic 78.2% |
| Choctaw | 0.0 /100 | #325 | Tragic 78.2% |
| Seminole | 0.0 /100 | #326 | Tragic 78.1% |
| Cajuns | 0.0 /100 | #327 | Tragic 78.1% |
| Sioux | 0.0 /100 | #328 | Tragic 78.0% |
| Creek | 0.0 /100 | #329 | Tragic 77.7% |
| Cheyenne | 0.0 /100 | #330 | Tragic 77.6% |
| Tsimshian | 0.0 /100 | #331 | Tragic 77.4% |
| Menominee | 0.0 /100 | #332 | Tragic 77.4% |
| Natives/Alaskans | 0.0 /100 | #333 | Tragic 77.1% |
| Apache | 0.0 /100 | #334 | Tragic 77.1% |
| Arapaho | 0.0 /100 | #335 | Tragic 77.1% |
| Paiute | 0.0 /100 | #336 | Tragic 76.7% |
| Ute | 0.0 /100 | #337 | Tragic 76.6% |
| Yuman | 0.0 /100 | #338 | Tragic 76.3% |
| Puerto Ricans | 0.0 /100 | #339 | Tragic 75.9% |
| Lumbee | 0.0 /100 | #340 | Tragic 75.6% |
| Pueblo | 0.0 /100 | #341 | Tragic 75.5% |
| Tohono O'odham | 0.0 /100 | #342 | Tragic 75.1% |
| Hopi | 0.0 /100 | #343 | Tragic 75.0% |