Czech vs Ute In Labor Force | Age 45-54
COMPARE
Czech
Ute
In Labor Force | Age 45-54
In Labor Force | Age 45-54 Comparison
Czechs
Ute
83.9%
IN LABOR FORCE | AGE 45-54
99.8/ 100
METRIC RATING
19th/ 347
METRIC RANK
76.6%
IN LABOR FORCE | AGE 45-54
0.0/ 100
METRIC RATING
337th/ 347
METRIC RANK
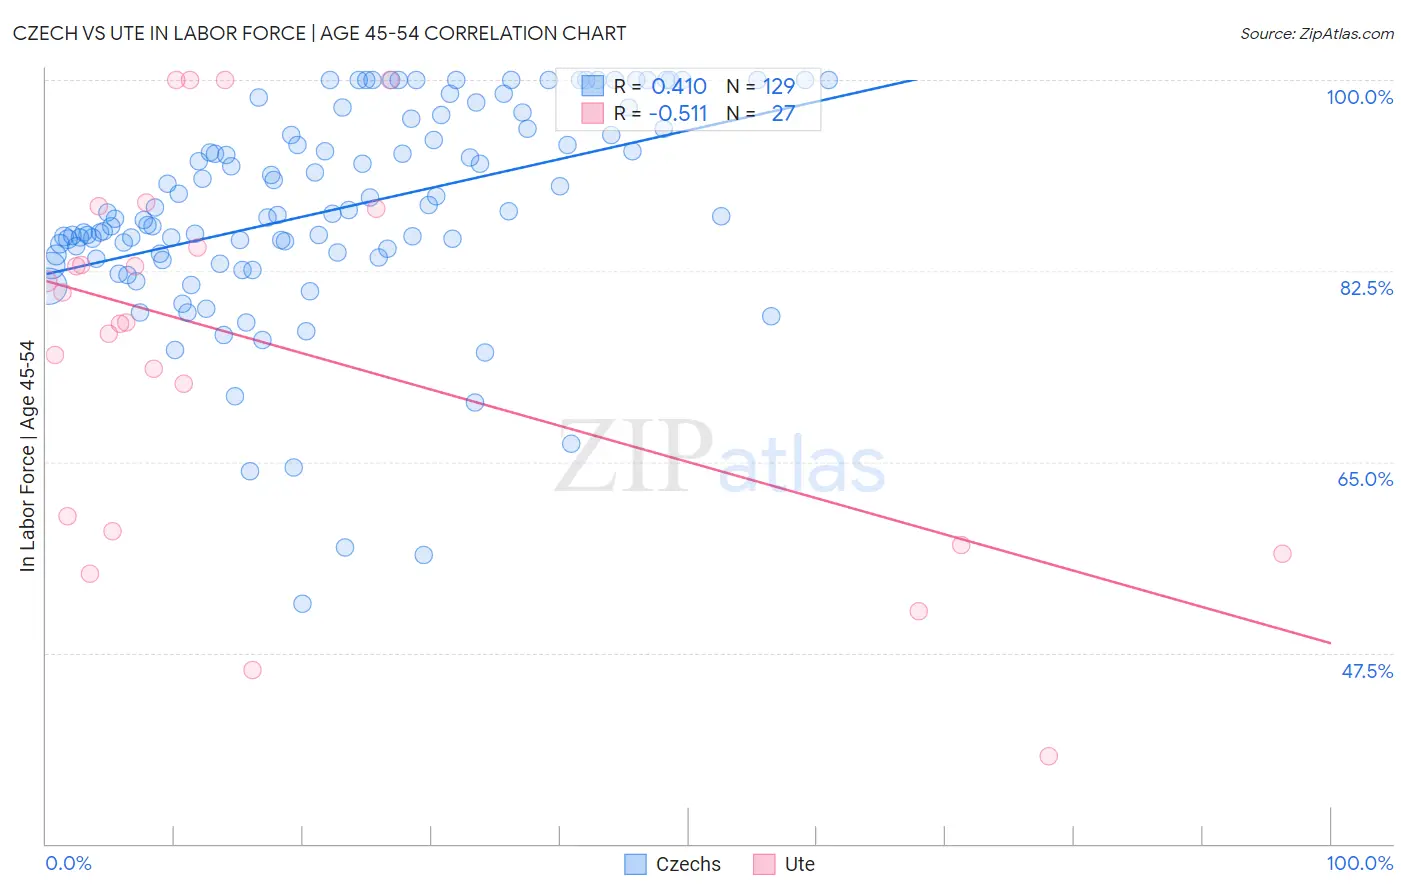
Czech vs Ute In Labor Force | Age 45-54 Correlation Chart
The statistical analysis conducted on geographies consisting of 484,423,200 people shows a moderate positive correlation between the proportion of Czechs and labor force participation rate among population between the ages 45 and 54 in the United States with a correlation coefficient (R) of 0.410 and weighted average of 83.9%. Similarly, the statistical analysis conducted on geographies consisting of 55,657,904 people shows a substantial negative correlation between the proportion of Ute and labor force participation rate among population between the ages 45 and 54 in the United States with a correlation coefficient (R) of -0.511 and weighted average of 76.6%, a difference of 9.5%.
In Labor Force | Age 45-54 Correlation Summary
| Measurement | Czech | Ute |
| Minimum | 51.9% | 38.0% |
| Maximum | 100.0% | 100.0% |
| Range | 48.1% | 62.0% |
| Mean | 88.1% | 75.4% |
| Median | 87.6% | 77.8% |
| Interquartile 25% (IQ1) | 83.9% | 58.6% |
| Interquartile 75% (IQ3) | 95.5% | 88.2% |
| Interquartile Range (IQR) | 11.6% | 29.6% |
| Standard Deviation (Sample) | 9.7% | 17.3% |
| Standard Deviation (Population) | 9.6% | 16.9% |
Similar Demographics by In Labor Force | Age 45-54
Demographics Similar to Czechs by In Labor Force | Age 45-54
In terms of in labor force | age 45-54, the demographic groups most similar to Czechs are Immigrants from Eastern Africa (83.9%, a difference of 0.010%), Immigrants from Sri Lanka (83.9%, a difference of 0.010%), Immigrants from Ireland (83.9%, a difference of 0.010%), Tlingit-Haida (83.9%, a difference of 0.020%), and Slovene (83.9%, a difference of 0.030%).
| Demographics | Rating | Rank | In Labor Force | Age 45-54 |
| Bulgarians | 100.0 /100 | #12 | Exceptional 84.2% |
| Chinese | 99.9 /100 | #13 | Exceptional 84.1% |
| Cambodians | 99.9 /100 | #14 | Exceptional 84.1% |
| Cypriots | 99.9 /100 | #15 | Exceptional 84.1% |
| Immigrants | Nepal | 99.9 /100 | #16 | Exceptional 84.0% |
| Zimbabweans | 99.9 /100 | #17 | Exceptional 84.0% |
| Immigrants | South Central Asia | 99.9 /100 | #18 | Exceptional 84.0% |
| Czechs | 99.8 /100 | #19 | Exceptional 83.9% |
| Immigrants | Eastern Africa | 99.8 /100 | #20 | Exceptional 83.9% |
| Immigrants | Sri Lanka | 99.8 /100 | #21 | Exceptional 83.9% |
| Immigrants | Ireland | 99.8 /100 | #22 | Exceptional 83.9% |
| Tlingit-Haida | 99.8 /100 | #23 | Exceptional 83.9% |
| Slovenes | 99.8 /100 | #24 | Exceptional 83.9% |
| Immigrants | North Macedonia | 99.8 /100 | #25 | Exceptional 83.9% |
| Immigrants | Serbia | 99.8 /100 | #26 | Exceptional 83.9% |
Demographics Similar to Ute by In Labor Force | Age 45-54
In terms of in labor force | age 45-54, the demographic groups most similar to Ute are Paiute (76.7%, a difference of 0.060%), Yuman (76.3%, a difference of 0.41%), Arapaho (77.1%, a difference of 0.60%), Native/Alaskan (77.1%, a difference of 0.67%), and Apache (77.1%, a difference of 0.67%).
| Demographics | Rating | Rank | In Labor Force | Age 45-54 |
| Cheyenne | 0.0 /100 | #330 | Tragic 77.6% |
| Tsimshian | 0.0 /100 | #331 | Tragic 77.4% |
| Menominee | 0.0 /100 | #332 | Tragic 77.4% |
| Natives/Alaskans | 0.0 /100 | #333 | Tragic 77.1% |
| Apache | 0.0 /100 | #334 | Tragic 77.1% |
| Arapaho | 0.0 /100 | #335 | Tragic 77.1% |
| Paiute | 0.0 /100 | #336 | Tragic 76.7% |
| Ute | 0.0 /100 | #337 | Tragic 76.6% |
| Yuman | 0.0 /100 | #338 | Tragic 76.3% |
| Puerto Ricans | 0.0 /100 | #339 | Tragic 75.9% |
| Lumbee | 0.0 /100 | #340 | Tragic 75.6% |
| Pueblo | 0.0 /100 | #341 | Tragic 75.5% |
| Tohono O'odham | 0.0 /100 | #342 | Tragic 75.1% |
| Hopi | 0.0 /100 | #343 | Tragic 75.0% |
| Immigrants | Yemen | 0.0 /100 | #344 | Tragic 74.4% |