Creek vs Jamaican In Labor Force | Age 45-54
COMPARE
Creek
Jamaican
In Labor Force | Age 45-54
In Labor Force | Age 45-54 Comparison
Creek
Jamaicans
77.7%
IN LABOR FORCE | AGE 45-54
0.0/ 100
METRIC RATING
329th/ 347
METRIC RANK
82.0%
IN LABOR FORCE | AGE 45-54
1.8/ 100
METRIC RATING
230th/ 347
METRIC RANK
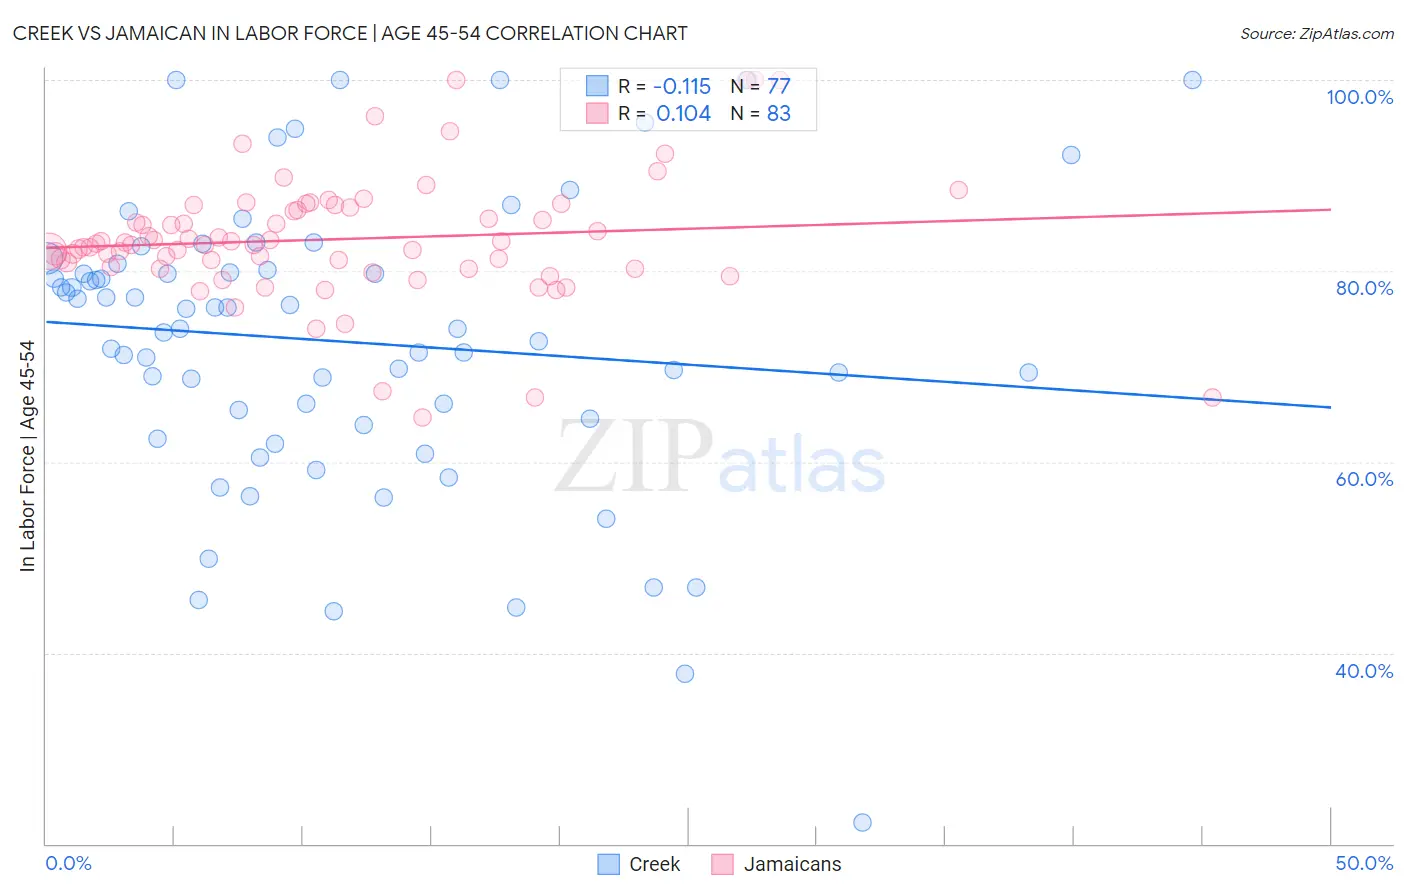
Creek vs Jamaican In Labor Force | Age 45-54 Correlation Chart
The statistical analysis conducted on geographies consisting of 178,432,423 people shows a poor negative correlation between the proportion of Creek and labor force participation rate among population between the ages 45 and 54 in the United States with a correlation coefficient (R) of -0.115 and weighted average of 77.7%. Similarly, the statistical analysis conducted on geographies consisting of 367,644,150 people shows a poor positive correlation between the proportion of Jamaicans and labor force participation rate among population between the ages 45 and 54 in the United States with a correlation coefficient (R) of 0.104 and weighted average of 82.0%, a difference of 5.5%.
In Labor Force | Age 45-54 Correlation Summary
| Measurement | Creek | Jamaican |
| Minimum | 22.2% | 64.7% |
| Maximum | 100.0% | 100.0% |
| Range | 77.8% | 35.3% |
| Mean | 72.6% | 83.3% |
| Median | 74.0% | 82.8% |
| Interquartile 25% (IQ1) | 64.2% | 80.3% |
| Interquartile 75% (IQ3) | 80.4% | 86.6% |
| Interquartile Range (IQR) | 16.2% | 6.3% |
| Standard Deviation (Sample) | 15.3% | 6.6% |
| Standard Deviation (Population) | 15.2% | 6.6% |
Similar Demographics by In Labor Force | Age 45-54
Demographics Similar to Creek by In Labor Force | Age 45-54
In terms of in labor force | age 45-54, the demographic groups most similar to Creek are Cheyenne (77.6%, a difference of 0.22%), Sioux (78.0%, a difference of 0.29%), Tsimshian (77.4%, a difference of 0.37%), Menominee (77.4%, a difference of 0.41%), and Cajun (78.1%, a difference of 0.51%).
| Demographics | Rating | Rank | In Labor Force | Age 45-54 |
| Crow | 0.0 /100 | #322 | Tragic 78.3% |
| Kiowa | 0.0 /100 | #323 | Tragic 78.3% |
| Dutch West Indians | 0.0 /100 | #324 | Tragic 78.2% |
| Choctaw | 0.0 /100 | #325 | Tragic 78.2% |
| Seminole | 0.0 /100 | #326 | Tragic 78.1% |
| Cajuns | 0.0 /100 | #327 | Tragic 78.1% |
| Sioux | 0.0 /100 | #328 | Tragic 78.0% |
| Creek | 0.0 /100 | #329 | Tragic 77.7% |
| Cheyenne | 0.0 /100 | #330 | Tragic 77.6% |
| Tsimshian | 0.0 /100 | #331 | Tragic 77.4% |
| Menominee | 0.0 /100 | #332 | Tragic 77.4% |
| Natives/Alaskans | 0.0 /100 | #333 | Tragic 77.1% |
| Apache | 0.0 /100 | #334 | Tragic 77.1% |
| Arapaho | 0.0 /100 | #335 | Tragic 77.1% |
| Paiute | 0.0 /100 | #336 | Tragic 76.7% |
Demographics Similar to Jamaicans by In Labor Force | Age 45-54
In terms of in labor force | age 45-54, the demographic groups most similar to Jamaicans are Immigrants from Burma/Myanmar (82.0%, a difference of 0.010%), Immigrants from Senegal (82.0%, a difference of 0.010%), Immigrants from Portugal (82.0%, a difference of 0.020%), Malaysian (82.0%, a difference of 0.020%), and Salvadoran (82.0%, a difference of 0.020%).
| Demographics | Rating | Rank | In Labor Force | Age 45-54 |
| Immigrants | Immigrants | 3.1 /100 | #223 | Tragic 82.1% |
| Immigrants | Jamaica | 2.7 /100 | #224 | Tragic 82.1% |
| Immigrants | Oceania | 2.5 /100 | #225 | Tragic 82.1% |
| Immigrants | Caribbean | 2.5 /100 | #226 | Tragic 82.1% |
| Immigrants | Germany | 2.4 /100 | #227 | Tragic 82.1% |
| Cape Verdeans | 2.1 /100 | #228 | Tragic 82.1% |
| Immigrants | Burma/Myanmar | 1.9 /100 | #229 | Tragic 82.0% |
| Jamaicans | 1.8 /100 | #230 | Tragic 82.0% |
| Immigrants | Senegal | 1.7 /100 | #231 | Tragic 82.0% |
| Immigrants | Portugal | 1.7 /100 | #232 | Tragic 82.0% |
| Malaysians | 1.7 /100 | #233 | Tragic 82.0% |
| Salvadorans | 1.7 /100 | #234 | Tragic 82.0% |
| Sub-Saharan Africans | 1.2 /100 | #235 | Tragic 82.0% |
| Basques | 1.2 /100 | #236 | Tragic 82.0% |
| Immigrants | Trinidad and Tobago | 1.2 /100 | #237 | Tragic 82.0% |