Sri Lankan vs Ute In Labor Force | Age 45-54
COMPARE
Sri Lankan
Ute
In Labor Force | Age 45-54
In Labor Force | Age 45-54 Comparison
Sri Lankans
Ute
83.2%
IN LABOR FORCE | AGE 45-54
93.2/ 100
METRIC RATING
106th/ 347
METRIC RANK
76.6%
IN LABOR FORCE | AGE 45-54
0.0/ 100
METRIC RATING
337th/ 347
METRIC RANK
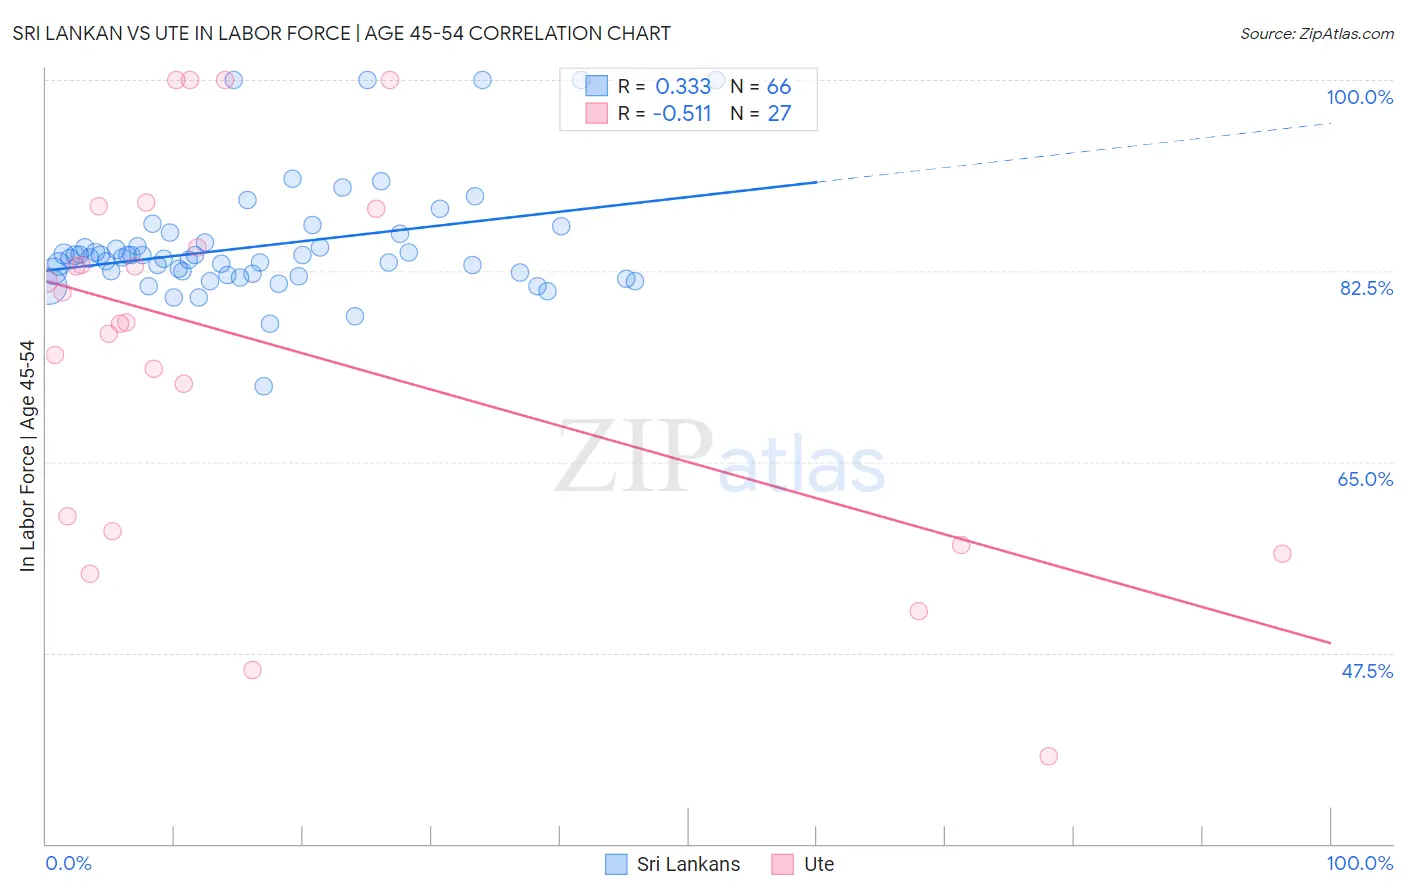
Sri Lankan vs Ute In Labor Force | Age 45-54 Correlation Chart
The statistical analysis conducted on geographies consisting of 440,078,973 people shows a mild positive correlation between the proportion of Sri Lankans and labor force participation rate among population between the ages 45 and 54 in the United States with a correlation coefficient (R) of 0.333 and weighted average of 83.2%. Similarly, the statistical analysis conducted on geographies consisting of 55,657,904 people shows a substantial negative correlation between the proportion of Ute and labor force participation rate among population between the ages 45 and 54 in the United States with a correlation coefficient (R) of -0.511 and weighted average of 76.6%, a difference of 8.6%.
In Labor Force | Age 45-54 Correlation Summary
| Measurement | Sri Lankan | Ute |
| Minimum | 72.0% | 38.0% |
| Maximum | 100.0% | 100.0% |
| Range | 28.0% | 62.0% |
| Mean | 84.8% | 75.4% |
| Median | 83.7% | 77.8% |
| Interquartile 25% (IQ1) | 82.2% | 58.6% |
| Interquartile 75% (IQ3) | 85.1% | 88.2% |
| Interquartile Range (IQR) | 2.8% | 29.6% |
| Standard Deviation (Sample) | 5.3% | 17.3% |
| Standard Deviation (Population) | 5.2% | 16.9% |
Similar Demographics by In Labor Force | Age 45-54
Demographics Similar to Sri Lankans by In Labor Force | Age 45-54
In terms of in labor force | age 45-54, the demographic groups most similar to Sri Lankans are Immigrants from South America (83.2%, a difference of 0.010%), Iranian (83.2%, a difference of 0.010%), Slovak (83.2%, a difference of 0.010%), Immigrants from Romania (83.3%, a difference of 0.020%), and Ukrainian (83.2%, a difference of 0.020%).
| Demographics | Rating | Rank | In Labor Force | Age 45-54 |
| Immigrants | Middle Africa | 94.3 /100 | #99 | Exceptional 83.3% |
| Mongolians | 94.2 /100 | #100 | Exceptional 83.3% |
| Immigrants | Belarus | 94.1 /100 | #101 | Exceptional 83.3% |
| Immigrants | Singapore | 93.9 /100 | #102 | Exceptional 83.3% |
| Albanians | 93.9 /100 | #103 | Exceptional 83.3% |
| Immigrants | Romania | 93.8 /100 | #104 | Exceptional 83.3% |
| Immigrants | South America | 93.5 /100 | #105 | Exceptional 83.2% |
| Sri Lankans | 93.2 /100 | #106 | Exceptional 83.2% |
| Iranians | 92.9 /100 | #107 | Exceptional 83.2% |
| Slovaks | 92.8 /100 | #108 | Exceptional 83.2% |
| Ukrainians | 92.7 /100 | #109 | Exceptional 83.2% |
| Immigrants | Africa | 92.6 /100 | #110 | Exceptional 83.2% |
| Immigrants | Italy | 92.5 /100 | #111 | Exceptional 83.2% |
| Immigrants | Afghanistan | 92.4 /100 | #112 | Exceptional 83.2% |
| Immigrants | Albania | 91.8 /100 | #113 | Exceptional 83.2% |
Demographics Similar to Ute by In Labor Force | Age 45-54
In terms of in labor force | age 45-54, the demographic groups most similar to Ute are Paiute (76.7%, a difference of 0.060%), Yuman (76.3%, a difference of 0.41%), Arapaho (77.1%, a difference of 0.60%), Native/Alaskan (77.1%, a difference of 0.67%), and Apache (77.1%, a difference of 0.67%).
| Demographics | Rating | Rank | In Labor Force | Age 45-54 |
| Cheyenne | 0.0 /100 | #330 | Tragic 77.6% |
| Tsimshian | 0.0 /100 | #331 | Tragic 77.4% |
| Menominee | 0.0 /100 | #332 | Tragic 77.4% |
| Natives/Alaskans | 0.0 /100 | #333 | Tragic 77.1% |
| Apache | 0.0 /100 | #334 | Tragic 77.1% |
| Arapaho | 0.0 /100 | #335 | Tragic 77.1% |
| Paiute | 0.0 /100 | #336 | Tragic 76.7% |
| Ute | 0.0 /100 | #337 | Tragic 76.6% |
| Yuman | 0.0 /100 | #338 | Tragic 76.3% |
| Puerto Ricans | 0.0 /100 | #339 | Tragic 75.9% |
| Lumbee | 0.0 /100 | #340 | Tragic 75.6% |
| Pueblo | 0.0 /100 | #341 | Tragic 75.5% |
| Tohono O'odham | 0.0 /100 | #342 | Tragic 75.1% |
| Hopi | 0.0 /100 | #343 | Tragic 75.0% |
| Immigrants | Yemen | 0.0 /100 | #344 | Tragic 74.4% |