Creek vs Ute Householder Income Ages 25 - 44 years
COMPARE
Creek
Ute
Householder Income Ages 25 - 44 years
Householder Income Ages 25 - 44 years Comparison
Creek
Ute
$74,847
HOUSEHOLDER INCOME AGES 25 - 44 YEARS
0.0/ 100
METRIC RATING
334th/ 347
METRIC RANK
$82,166
HOUSEHOLDER INCOME AGES 25 - 44 YEARS
0.1/ 100
METRIC RATING
286th/ 347
METRIC RANK
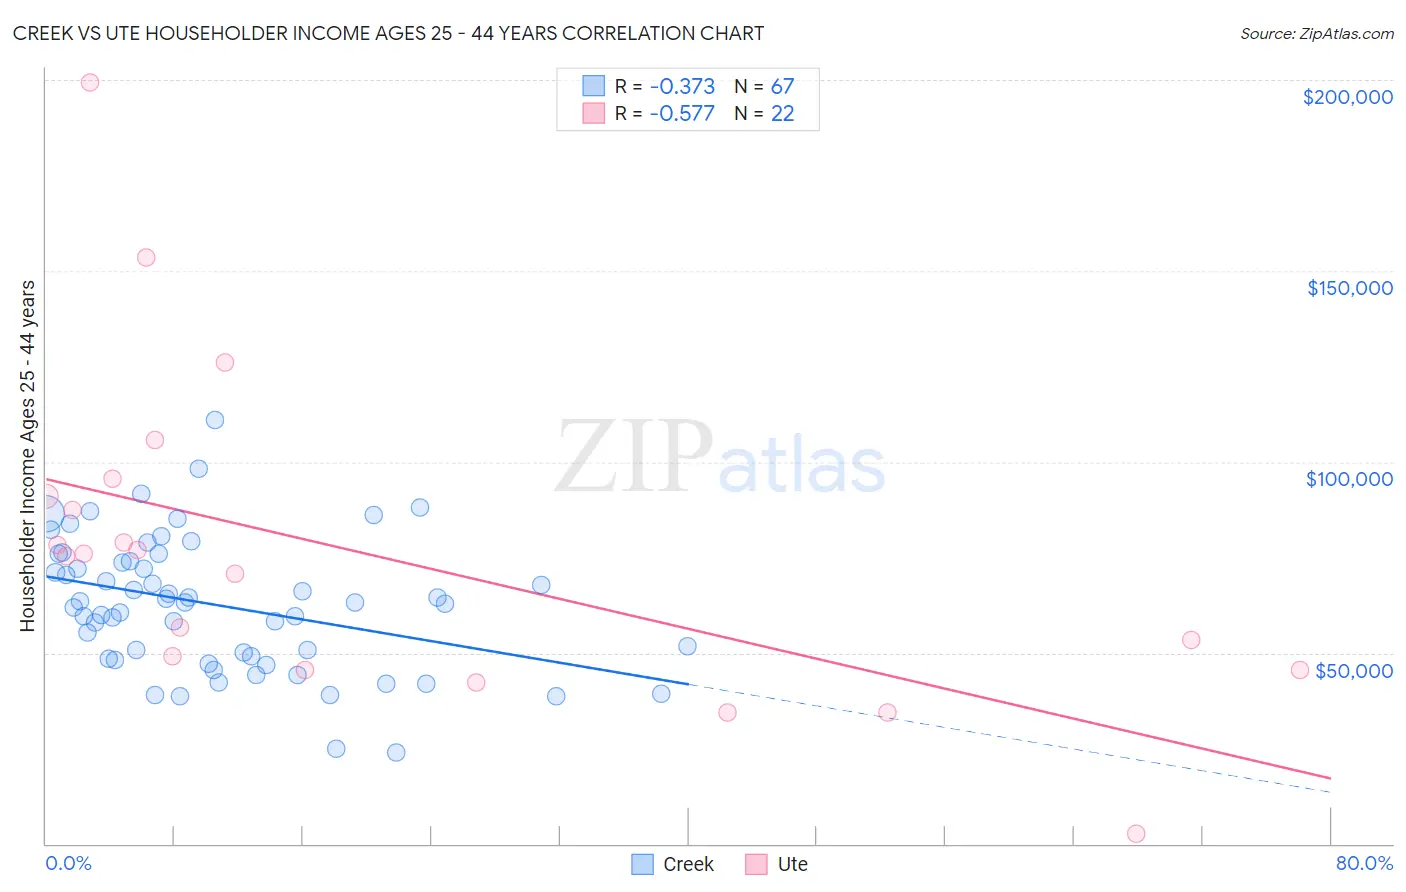
Creek vs Ute Householder Income Ages 25 - 44 years Correlation Chart
The statistical analysis conducted on geographies consisting of 178,137,913 people shows a mild negative correlation between the proportion of Creek and household income with householder between the ages 25 and 44 in the United States with a correlation coefficient (R) of -0.373 and weighted average of $74,847. Similarly, the statistical analysis conducted on geographies consisting of 55,634,339 people shows a substantial negative correlation between the proportion of Ute and household income with householder between the ages 25 and 44 in the United States with a correlation coefficient (R) of -0.577 and weighted average of $82,166, a difference of 9.8%.
Householder Income Ages 25 - 44 years Correlation Summary
| Measurement | Creek | Ute |
| Minimum | $23,750 | $2,499 |
| Maximum | $110,938 | $199,336 |
| Range | $87,188 | $196,837 |
| Mean | $62,466 | $76,298 |
| Median | $63,125 | $75,607 |
| Interquartile 25% (IQ1) | $48,423 | $45,625 |
| Interquartile 75% (IQ3) | $74,039 | $91,160 |
| Interquartile Range (IQR) | $25,616 | $45,535 |
| Standard Deviation (Sample) | $17,416 | $43,022 |
| Standard Deviation (Population) | $17,285 | $42,033 |
Similar Demographics by Householder Income Ages 25 - 44 years
Demographics Similar to Creek by Householder Income Ages 25 - 44 years
In terms of householder income ages 25 - 44 years, the demographic groups most similar to Creek are Kiowa ($74,776, a difference of 0.10%), Hopi ($75,002, a difference of 0.21%), Bahamian ($75,395, a difference of 0.73%), Native/Alaskan ($75,647, a difference of 1.1%), and Yup'ik ($73,688, a difference of 1.6%).
| Demographics | Rating | Rank | Householder Income Ages 25 - 44 years |
| Immigrants | Bahamas | 0.0 /100 | #327 | Tragic $76,910 |
| Immigrants | Cuba | 0.0 /100 | #328 | Tragic $76,701 |
| Seminole | 0.0 /100 | #329 | Tragic $76,584 |
| Yakama | 0.0 /100 | #330 | Tragic $76,226 |
| Natives/Alaskans | 0.0 /100 | #331 | Tragic $75,647 |
| Bahamians | 0.0 /100 | #332 | Tragic $75,395 |
| Hopi | 0.0 /100 | #333 | Tragic $75,002 |
| Creek | 0.0 /100 | #334 | Tragic $74,847 |
| Kiowa | 0.0 /100 | #335 | Tragic $74,776 |
| Yup'ik | 0.0 /100 | #336 | Tragic $73,688 |
| Blacks/African Americans | 0.0 /100 | #337 | Tragic $73,370 |
| Immigrants | Yemen | 0.0 /100 | #338 | Tragic $73,043 |
| Yuman | 0.0 /100 | #339 | Tragic $72,956 |
| Immigrants | Congo | 0.0 /100 | #340 | Tragic $72,178 |
| Arapaho | 0.0 /100 | #341 | Tragic $71,697 |
Demographics Similar to Ute by Householder Income Ages 25 - 44 years
In terms of householder income ages 25 - 44 years, the demographic groups most similar to Ute are Immigrants from Latin America ($82,166, a difference of 0.0%), Comanche ($82,152, a difference of 0.020%), Immigrants from Somalia ($82,188, a difference of 0.030%), Immigrants from Middle Africa ($82,254, a difference of 0.11%), and Shoshone ($82,062, a difference of 0.13%).
| Demographics | Rating | Rank | Householder Income Ages 25 - 44 years |
| Pima | 0.1 /100 | #279 | Tragic $82,821 |
| Colville | 0.1 /100 | #280 | Tragic $82,604 |
| Cajuns | 0.1 /100 | #281 | Tragic $82,393 |
| Central American Indians | 0.1 /100 | #282 | Tragic $82,355 |
| Guatemalans | 0.1 /100 | #283 | Tragic $82,331 |
| Immigrants | Middle Africa | 0.1 /100 | #284 | Tragic $82,254 |
| Immigrants | Somalia | 0.1 /100 | #285 | Tragic $82,188 |
| Ute | 0.1 /100 | #286 | Tragic $82,166 |
| Immigrants | Latin America | 0.1 /100 | #287 | Tragic $82,166 |
| Comanche | 0.1 /100 | #288 | Tragic $82,152 |
| Shoshone | 0.1 /100 | #289 | Tragic $82,062 |
| Liberians | 0.1 /100 | #290 | Tragic $82,005 |
| Potawatomi | 0.1 /100 | #291 | Tragic $81,774 |
| Yaqui | 0.1 /100 | #292 | Tragic $81,656 |
| Blackfeet | 0.1 /100 | #293 | Tragic $81,531 |