Immigrants from Switzerland vs Ute In Labor Force | Age 45-54
COMPARE
Immigrants from Switzerland
Ute
In Labor Force | Age 45-54
In Labor Force | Age 45-54 Comparison
Immigrants from Switzerland
Ute
82.7%
IN LABOR FORCE | AGE 45-54
39.4/ 100
METRIC RATING
179th/ 347
METRIC RANK
76.6%
IN LABOR FORCE | AGE 45-54
0.0/ 100
METRIC RATING
337th/ 347
METRIC RANK
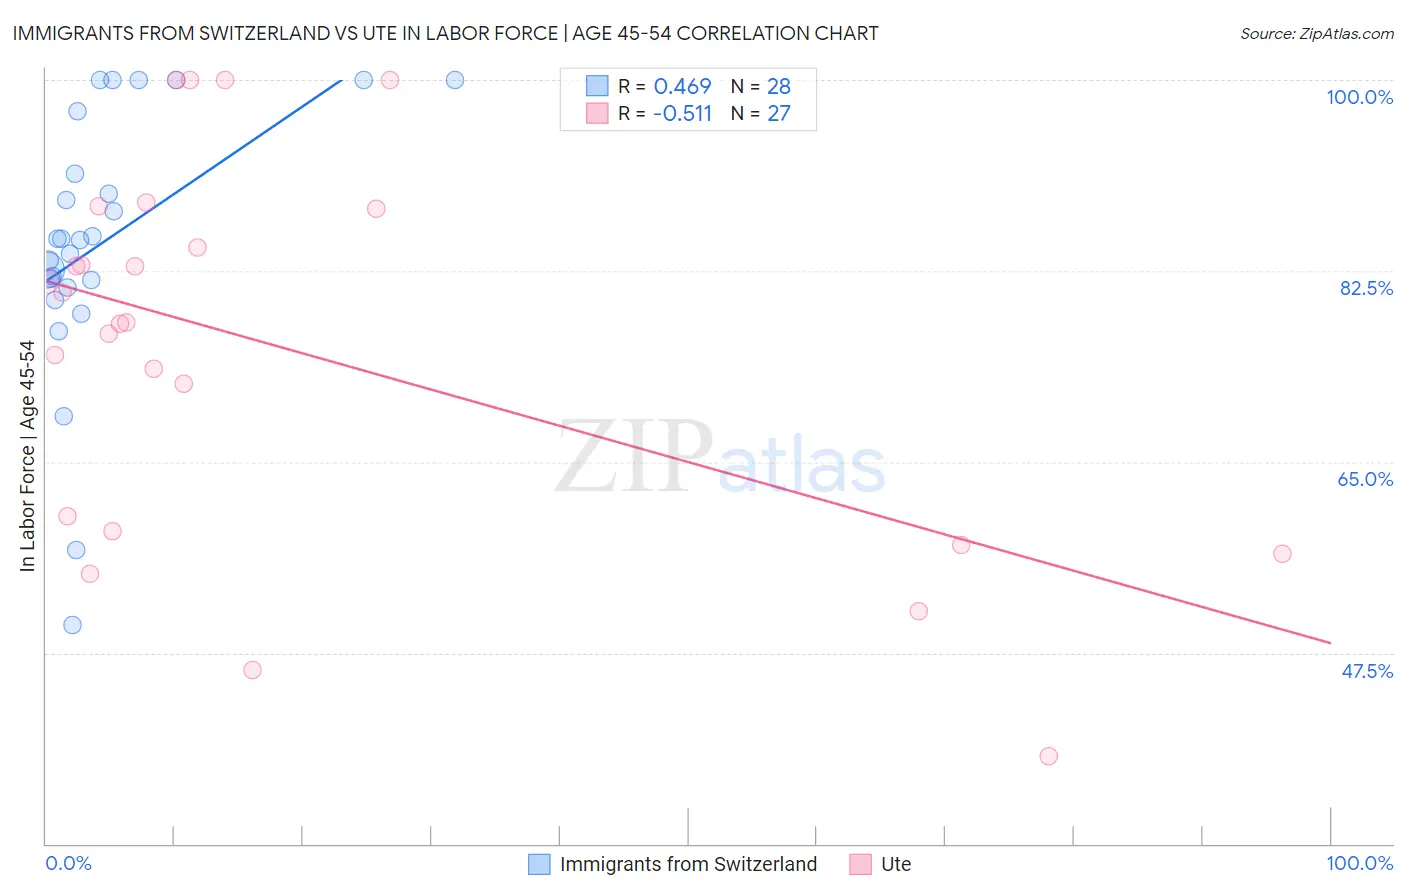
Immigrants from Switzerland vs Ute In Labor Force | Age 45-54 Correlation Chart
The statistical analysis conducted on geographies consisting of 148,071,705 people shows a moderate positive correlation between the proportion of Immigrants from Switzerland and labor force participation rate among population between the ages 45 and 54 in the United States with a correlation coefficient (R) of 0.469 and weighted average of 82.7%. Similarly, the statistical analysis conducted on geographies consisting of 55,657,904 people shows a substantial negative correlation between the proportion of Ute and labor force participation rate among population between the ages 45 and 54 in the United States with a correlation coefficient (R) of -0.511 and weighted average of 76.6%, a difference of 7.9%.
In Labor Force | Age 45-54 Correlation Summary
| Measurement | Immigrants from Switzerland | Ute |
| Minimum | 50.0% | 38.0% |
| Maximum | 100.0% | 100.0% |
| Range | 50.0% | 62.0% |
| Mean | 85.2% | 75.4% |
| Median | 85.4% | 77.8% |
| Interquartile 25% (IQ1) | 81.4% | 58.6% |
| Interquartile 75% (IQ3) | 94.3% | 88.2% |
| Interquartile Range (IQR) | 12.9% | 29.6% |
| Standard Deviation (Sample) | 12.2% | 17.3% |
| Standard Deviation (Population) | 12.0% | 16.9% |
Similar Demographics by In Labor Force | Age 45-54
Demographics Similar to Immigrants from Switzerland by In Labor Force | Age 45-54
In terms of in labor force | age 45-54, the demographic groups most similar to Immigrants from Switzerland are Nigerian (82.7%, a difference of 0.010%), Hungarian (82.7%, a difference of 0.010%), Israeli (82.7%, a difference of 0.020%), Immigrants from Hungary (82.7%, a difference of 0.020%), and Immigrants from Nicaragua (82.7%, a difference of 0.050%).
| Demographics | Rating | Rank | In Labor Force | Age 45-54 |
| Icelanders | 51.8 /100 | #172 | Average 82.8% |
| Nicaraguans | 50.3 /100 | #173 | Average 82.8% |
| Costa Ricans | 50.0 /100 | #174 | Average 82.8% |
| Immigrants | Liberia | 47.9 /100 | #175 | Average 82.7% |
| Northern Europeans | 46.9 /100 | #176 | Average 82.7% |
| Immigrants | Nicaragua | 44.6 /100 | #177 | Average 82.7% |
| Nigerians | 40.5 /100 | #178 | Average 82.7% |
| Immigrants | Switzerland | 39.4 /100 | #179 | Fair 82.7% |
| Hungarians | 38.0 /100 | #180 | Fair 82.7% |
| Israelis | 37.7 /100 | #181 | Fair 82.7% |
| Immigrants | Hungary | 37.1 /100 | #182 | Fair 82.7% |
| New Zealanders | 32.7 /100 | #183 | Fair 82.6% |
| Europeans | 32.6 /100 | #184 | Fair 82.6% |
| Immigrants | England | 32.2 /100 | #185 | Fair 82.6% |
| Irish | 29.2 /100 | #186 | Fair 82.6% |
Demographics Similar to Ute by In Labor Force | Age 45-54
In terms of in labor force | age 45-54, the demographic groups most similar to Ute are Paiute (76.7%, a difference of 0.060%), Yuman (76.3%, a difference of 0.41%), Arapaho (77.1%, a difference of 0.60%), Native/Alaskan (77.1%, a difference of 0.67%), and Apache (77.1%, a difference of 0.67%).
| Demographics | Rating | Rank | In Labor Force | Age 45-54 |
| Cheyenne | 0.0 /100 | #330 | Tragic 77.6% |
| Tsimshian | 0.0 /100 | #331 | Tragic 77.4% |
| Menominee | 0.0 /100 | #332 | Tragic 77.4% |
| Natives/Alaskans | 0.0 /100 | #333 | Tragic 77.1% |
| Apache | 0.0 /100 | #334 | Tragic 77.1% |
| Arapaho | 0.0 /100 | #335 | Tragic 77.1% |
| Paiute | 0.0 /100 | #336 | Tragic 76.7% |
| Ute | 0.0 /100 | #337 | Tragic 76.6% |
| Yuman | 0.0 /100 | #338 | Tragic 76.3% |
| Puerto Ricans | 0.0 /100 | #339 | Tragic 75.9% |
| Lumbee | 0.0 /100 | #340 | Tragic 75.6% |
| Pueblo | 0.0 /100 | #341 | Tragic 75.5% |
| Tohono O'odham | 0.0 /100 | #342 | Tragic 75.1% |
| Hopi | 0.0 /100 | #343 | Tragic 75.0% |
| Immigrants | Yemen | 0.0 /100 | #344 | Tragic 74.4% |