Creek vs Somali In Labor Force | Age 45-54
COMPARE
Creek
Somali
In Labor Force | Age 45-54
In Labor Force | Age 45-54 Comparison
Creek
Somalis
77.7%
IN LABOR FORCE | AGE 45-54
0.0/ 100
METRIC RATING
329th/ 347
METRIC RANK
83.5%
IN LABOR FORCE | AGE 45-54
98.7/ 100
METRIC RATING
54th/ 347
METRIC RANK
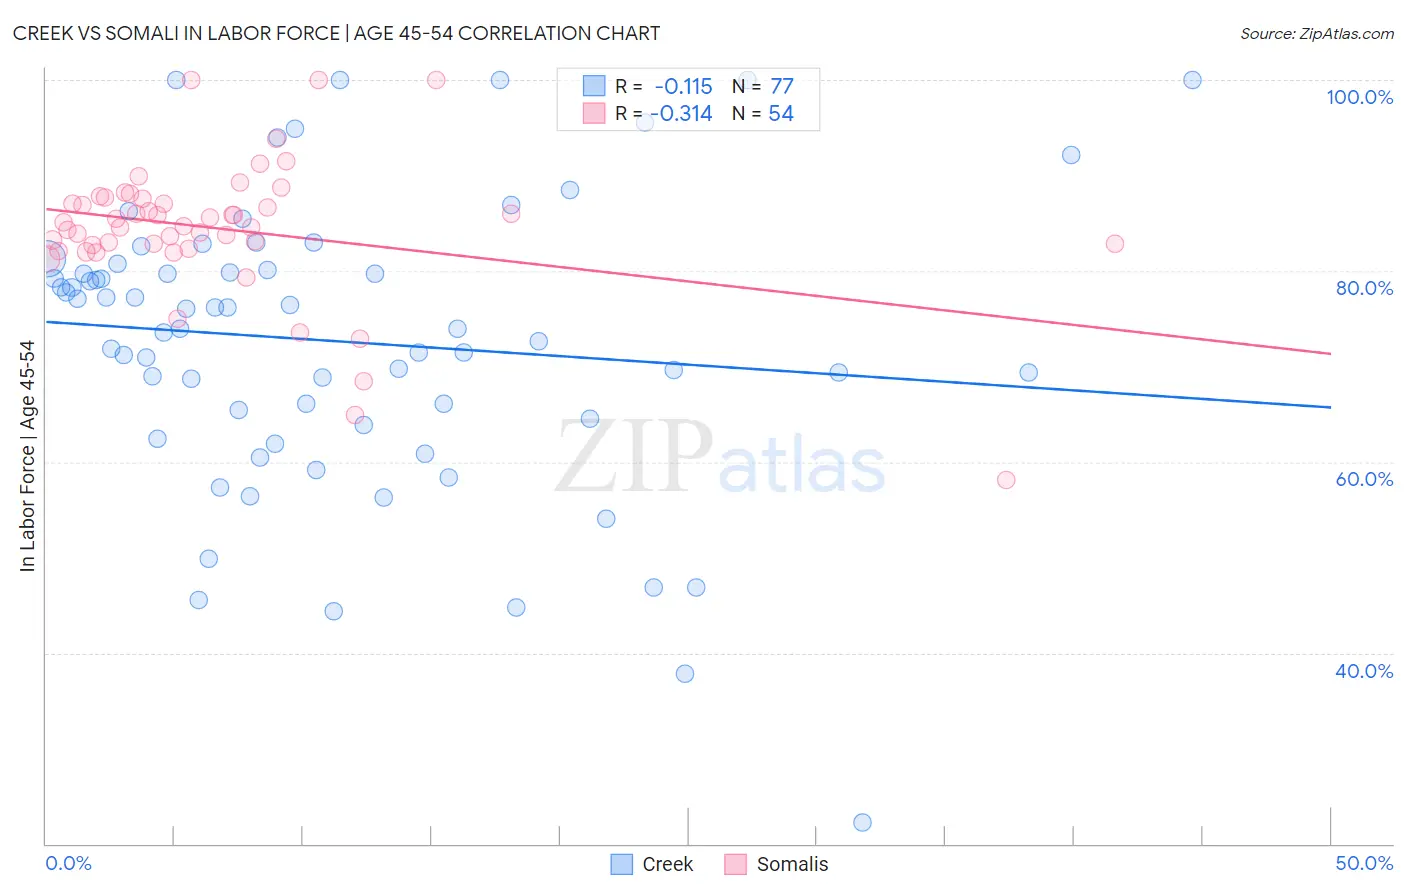
Creek vs Somali In Labor Force | Age 45-54 Correlation Chart
The statistical analysis conducted on geographies consisting of 178,432,423 people shows a poor negative correlation between the proportion of Creek and labor force participation rate among population between the ages 45 and 54 in the United States with a correlation coefficient (R) of -0.115 and weighted average of 77.7%. Similarly, the statistical analysis conducted on geographies consisting of 99,291,409 people shows a mild negative correlation between the proportion of Somalis and labor force participation rate among population between the ages 45 and 54 in the United States with a correlation coefficient (R) of -0.314 and weighted average of 83.5%, a difference of 7.5%.
In Labor Force | Age 45-54 Correlation Summary
| Measurement | Creek | Somali |
| Minimum | 22.2% | 58.1% |
| Maximum | 100.0% | 100.0% |
| Range | 77.8% | 41.9% |
| Mean | 72.6% | 84.4% |
| Median | 74.0% | 84.9% |
| Interquartile 25% (IQ1) | 64.2% | 82.7% |
| Interquartile 75% (IQ3) | 80.4% | 87.6% |
| Interquartile Range (IQR) | 16.2% | 4.9% |
| Standard Deviation (Sample) | 15.3% | 7.3% |
| Standard Deviation (Population) | 15.2% | 7.3% |
Similar Demographics by In Labor Force | Age 45-54
Demographics Similar to Creek by In Labor Force | Age 45-54
In terms of in labor force | age 45-54, the demographic groups most similar to Creek are Cheyenne (77.6%, a difference of 0.22%), Sioux (78.0%, a difference of 0.29%), Tsimshian (77.4%, a difference of 0.37%), Menominee (77.4%, a difference of 0.41%), and Cajun (78.1%, a difference of 0.51%).
| Demographics | Rating | Rank | In Labor Force | Age 45-54 |
| Crow | 0.0 /100 | #322 | Tragic 78.3% |
| Kiowa | 0.0 /100 | #323 | Tragic 78.3% |
| Dutch West Indians | 0.0 /100 | #324 | Tragic 78.2% |
| Choctaw | 0.0 /100 | #325 | Tragic 78.2% |
| Seminole | 0.0 /100 | #326 | Tragic 78.1% |
| Cajuns | 0.0 /100 | #327 | Tragic 78.1% |
| Sioux | 0.0 /100 | #328 | Tragic 78.0% |
| Creek | 0.0 /100 | #329 | Tragic 77.7% |
| Cheyenne | 0.0 /100 | #330 | Tragic 77.6% |
| Tsimshian | 0.0 /100 | #331 | Tragic 77.4% |
| Menominee | 0.0 /100 | #332 | Tragic 77.4% |
| Natives/Alaskans | 0.0 /100 | #333 | Tragic 77.1% |
| Apache | 0.0 /100 | #334 | Tragic 77.1% |
| Arapaho | 0.0 /100 | #335 | Tragic 77.1% |
| Paiute | 0.0 /100 | #336 | Tragic 76.7% |
Demographics Similar to Somalis by In Labor Force | Age 45-54
In terms of in labor force | age 45-54, the demographic groups most similar to Somalis are Immigrants from Turkey (83.6%, a difference of 0.010%), Polish (83.6%, a difference of 0.010%), Peruvian (83.6%, a difference of 0.010%), Macedonian (83.5%, a difference of 0.010%), and Immigrants from Greece (83.6%, a difference of 0.020%).
| Demographics | Rating | Rank | In Labor Force | Age 45-54 |
| Croatians | 99.0 /100 | #47 | Exceptional 83.6% |
| Immigrants | Poland | 99.0 /100 | #48 | Exceptional 83.6% |
| Immigrants | Morocco | 99.0 /100 | #49 | Exceptional 83.6% |
| Immigrants | Greece | 98.8 /100 | #50 | Exceptional 83.6% |
| Immigrants | Turkey | 98.8 /100 | #51 | Exceptional 83.6% |
| Poles | 98.7 /100 | #52 | Exceptional 83.6% |
| Peruvians | 98.7 /100 | #53 | Exceptional 83.6% |
| Somalis | 98.7 /100 | #54 | Exceptional 83.5% |
| Macedonians | 98.7 /100 | #55 | Exceptional 83.5% |
| Immigrants | Peru | 98.6 /100 | #56 | Exceptional 83.5% |
| Paraguayans | 98.5 /100 | #57 | Exceptional 83.5% |
| Eastern Europeans | 98.5 /100 | #58 | Exceptional 83.5% |
| Bhutanese | 98.3 /100 | #59 | Exceptional 83.5% |
| Carpatho Rusyns | 98.3 /100 | #60 | Exceptional 83.5% |
| Filipinos | 98.3 /100 | #61 | Exceptional 83.5% |