Carpatho Rusyn vs Ute In Labor Force | Age 45-54
COMPARE
Carpatho Rusyn
Ute
In Labor Force | Age 45-54
In Labor Force | Age 45-54 Comparison
Carpatho Rusyns
Ute
83.5%
IN LABOR FORCE | AGE 45-54
98.3/ 100
METRIC RATING
60th/ 347
METRIC RANK
76.6%
IN LABOR FORCE | AGE 45-54
0.0/ 100
METRIC RATING
337th/ 347
METRIC RANK
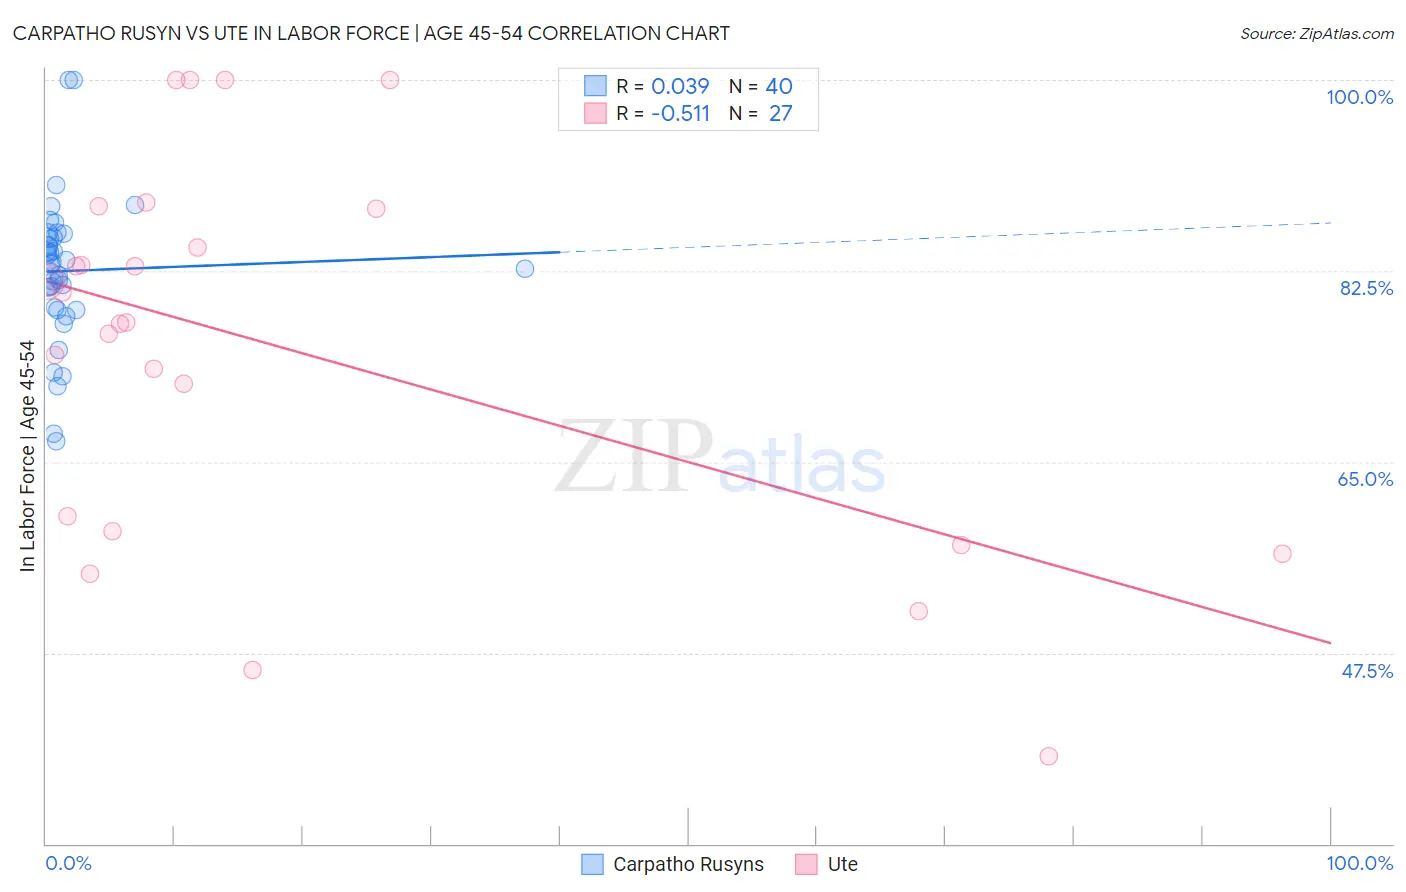
Carpatho Rusyn vs Ute In Labor Force | Age 45-54 Correlation Chart
The statistical analysis conducted on geographies consisting of 58,870,959 people shows no correlation between the proportion of Carpatho Rusyns and labor force participation rate among population between the ages 45 and 54 in the United States with a correlation coefficient (R) of 0.039 and weighted average of 83.5%. Similarly, the statistical analysis conducted on geographies consisting of 55,657,904 people shows a substantial negative correlation between the proportion of Ute and labor force participation rate among population between the ages 45 and 54 in the United States with a correlation coefficient (R) of -0.511 and weighted average of 76.6%, a difference of 9.0%.
In Labor Force | Age 45-54 Correlation Summary
| Measurement | Carpatho Rusyn | Ute |
| Minimum | 66.9% | 38.0% |
| Maximum | 100.0% | 100.0% |
| Range | 33.1% | 62.0% |
| Mean | 82.5% | 75.4% |
| Median | 83.2% | 77.8% |
| Interquartile 25% (IQ1) | 79.1% | 58.6% |
| Interquartile 75% (IQ3) | 85.7% | 88.2% |
| Interquartile Range (IQR) | 6.6% | 29.6% |
| Standard Deviation (Sample) | 6.7% | 17.3% |
| Standard Deviation (Population) | 6.6% | 16.9% |
Similar Demographics by In Labor Force | Age 45-54
Demographics Similar to Carpatho Rusyns by In Labor Force | Age 45-54
In terms of in labor force | age 45-54, the demographic groups most similar to Carpatho Rusyns are Bhutanese (83.5%, a difference of 0.0%), Filipino (83.5%, a difference of 0.0%), Eastern European (83.5%, a difference of 0.020%), Paraguayan (83.5%, a difference of 0.030%), and Immigrants from Taiwan (83.5%, a difference of 0.030%).
| Demographics | Rating | Rank | In Labor Force | Age 45-54 |
| Peruvians | 98.7 /100 | #53 | Exceptional 83.6% |
| Somalis | 98.7 /100 | #54 | Exceptional 83.5% |
| Macedonians | 98.7 /100 | #55 | Exceptional 83.5% |
| Immigrants | Peru | 98.6 /100 | #56 | Exceptional 83.5% |
| Paraguayans | 98.5 /100 | #57 | Exceptional 83.5% |
| Eastern Europeans | 98.5 /100 | #58 | Exceptional 83.5% |
| Bhutanese | 98.3 /100 | #59 | Exceptional 83.5% |
| Carpatho Rusyns | 98.3 /100 | #60 | Exceptional 83.5% |
| Filipinos | 98.3 /100 | #61 | Exceptional 83.5% |
| Immigrants | Taiwan | 98.0 /100 | #62 | Exceptional 83.5% |
| Afghans | 97.9 /100 | #63 | Exceptional 83.5% |
| Immigrants | Kenya | 97.9 /100 | #64 | Exceptional 83.5% |
| Egyptians | 97.9 /100 | #65 | Exceptional 83.5% |
| Asians | 97.7 /100 | #66 | Exceptional 83.4% |
| Chileans | 97.7 /100 | #67 | Exceptional 83.4% |
Demographics Similar to Ute by In Labor Force | Age 45-54
In terms of in labor force | age 45-54, the demographic groups most similar to Ute are Paiute (76.7%, a difference of 0.060%), Yuman (76.3%, a difference of 0.41%), Arapaho (77.1%, a difference of 0.60%), Native/Alaskan (77.1%, a difference of 0.67%), and Apache (77.1%, a difference of 0.67%).
| Demographics | Rating | Rank | In Labor Force | Age 45-54 |
| Cheyenne | 0.0 /100 | #330 | Tragic 77.6% |
| Tsimshian | 0.0 /100 | #331 | Tragic 77.4% |
| Menominee | 0.0 /100 | #332 | Tragic 77.4% |
| Natives/Alaskans | 0.0 /100 | #333 | Tragic 77.1% |
| Apache | 0.0 /100 | #334 | Tragic 77.1% |
| Arapaho | 0.0 /100 | #335 | Tragic 77.1% |
| Paiute | 0.0 /100 | #336 | Tragic 76.7% |
| Ute | 0.0 /100 | #337 | Tragic 76.6% |
| Yuman | 0.0 /100 | #338 | Tragic 76.3% |
| Puerto Ricans | 0.0 /100 | #339 | Tragic 75.9% |
| Lumbee | 0.0 /100 | #340 | Tragic 75.6% |
| Pueblo | 0.0 /100 | #341 | Tragic 75.5% |
| Tohono O'odham | 0.0 /100 | #342 | Tragic 75.1% |
| Hopi | 0.0 /100 | #343 | Tragic 75.0% |
| Immigrants | Yemen | 0.0 /100 | #344 | Tragic 74.4% |