Creek vs Immigrants from Trinidad and Tobago In Labor Force | Age 25-29
COMPARE
Creek
Immigrants from Trinidad and Tobago
In Labor Force | Age 25-29
In Labor Force | Age 25-29 Comparison
Creek
Immigrants from Trinidad and Tobago
80.7%
IN LABOR FORCE | AGE 25-29
0.0/ 100
METRIC RATING
328th/ 347
METRIC RANK
83.7%
IN LABOR FORCE | AGE 25-29
0.2/ 100
METRIC RATING
253rd/ 347
METRIC RANK
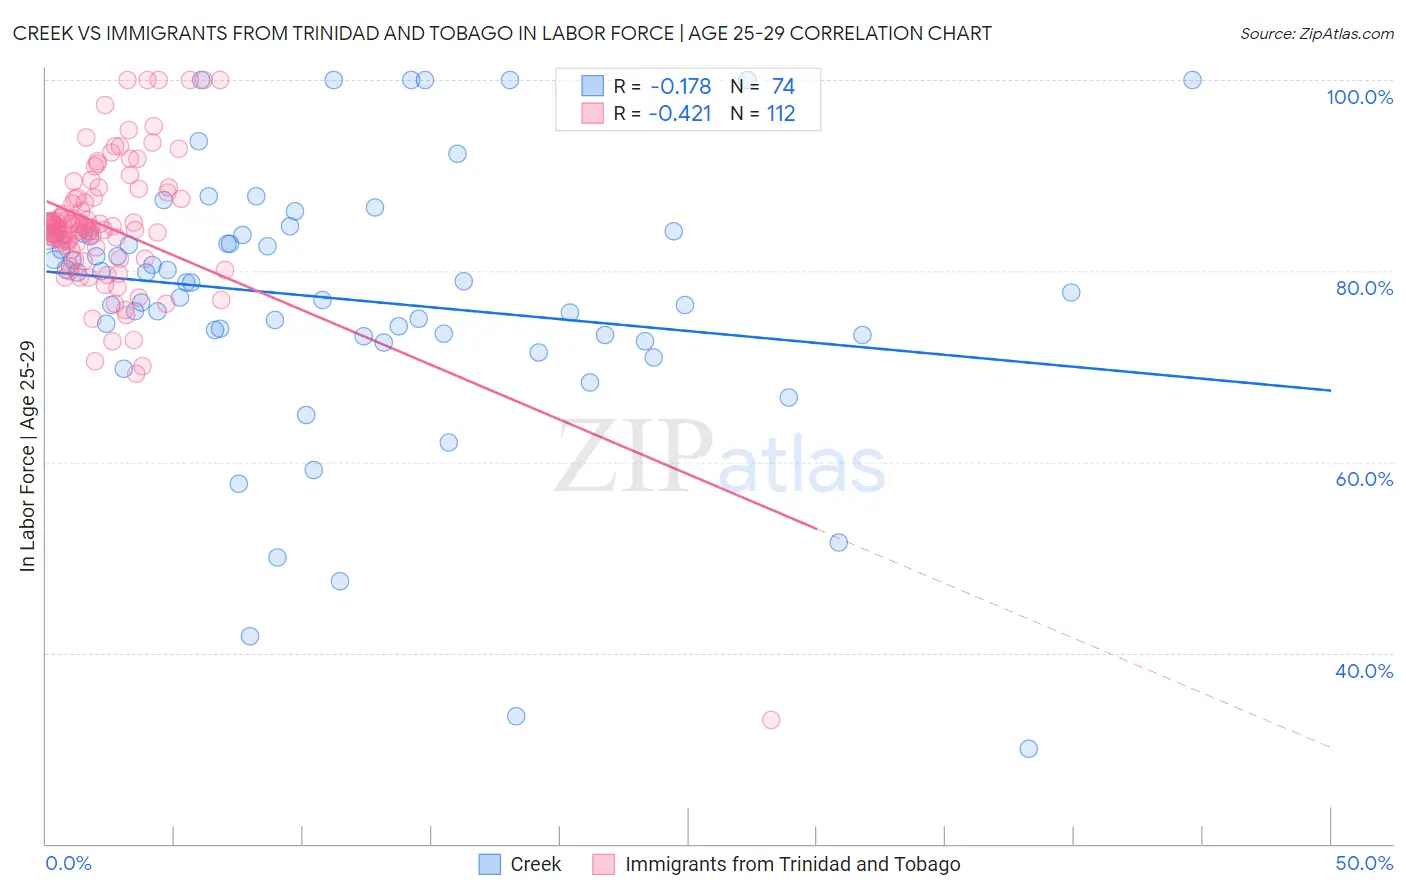
Creek vs Immigrants from Trinidad and Tobago In Labor Force | Age 25-29 Correlation Chart
The statistical analysis conducted on geographies consisting of 178,425,727 people shows a poor negative correlation between the proportion of Creek and labor force participation rate among population between the ages 25 and 29 in the United States with a correlation coefficient (R) of -0.178 and weighted average of 80.7%. Similarly, the statistical analysis conducted on geographies consisting of 223,499,686 people shows a moderate negative correlation between the proportion of Immigrants from Trinidad and Tobago and labor force participation rate among population between the ages 25 and 29 in the United States with a correlation coefficient (R) of -0.421 and weighted average of 83.7%, a difference of 3.7%.
In Labor Force | Age 25-29 Correlation Summary
| Measurement | Creek | Immigrants from Trinidad and Tobago |
| Minimum | 30.0% | 32.9% |
| Maximum | 100.0% | 100.0% |
| Range | 70.0% | 67.1% |
| Mean | 77.0% | 84.6% |
| Median | 78.8% | 84.5% |
| Interquartile 25% (IQ1) | 73.3% | 82.3% |
| Interquartile 75% (IQ3) | 83.8% | 87.7% |
| Interquartile Range (IQR) | 10.5% | 5.4% |
| Standard Deviation (Sample) | 14.1% | 8.0% |
| Standard Deviation (Population) | 14.0% | 8.0% |
Similar Demographics by In Labor Force | Age 25-29
Demographics Similar to Creek by In Labor Force | Age 25-29
In terms of in labor force | age 25-29, the demographic groups most similar to Creek are Yakama (80.6%, a difference of 0.11%), Ute (80.8%, a difference of 0.15%), Puerto Rican (80.4%, a difference of 0.34%), Choctaw (81.0%, a difference of 0.35%), and Cheyenne (80.3%, a difference of 0.48%).
| Demographics | Rating | Rank | In Labor Force | Age 25-29 |
| Shoshone | 0.0 /100 | #321 | Tragic 81.6% |
| Kiowa | 0.0 /100 | #322 | Tragic 81.6% |
| Alaska Natives | 0.0 /100 | #323 | Tragic 81.6% |
| Houma | 0.0 /100 | #324 | Tragic 81.2% |
| Dutch West Indians | 0.0 /100 | #325 | Tragic 81.1% |
| Choctaw | 0.0 /100 | #326 | Tragic 81.0% |
| Ute | 0.0 /100 | #327 | Tragic 80.8% |
| Creek | 0.0 /100 | #328 | Tragic 80.7% |
| Yakama | 0.0 /100 | #329 | Tragic 80.6% |
| Puerto Ricans | 0.0 /100 | #330 | Tragic 80.4% |
| Cheyenne | 0.0 /100 | #331 | Tragic 80.3% |
| Inupiat | 0.0 /100 | #332 | Tragic 79.8% |
| Sioux | 0.0 /100 | #333 | Tragic 79.7% |
| Yuman | 0.0 /100 | #334 | Tragic 79.3% |
| Natives/Alaskans | 0.0 /100 | #335 | Tragic 79.3% |
Demographics Similar to Immigrants from Trinidad and Tobago by In Labor Force | Age 25-29
In terms of in labor force | age 25-29, the demographic groups most similar to Immigrants from Trinidad and Tobago are Guatemalan (83.7%, a difference of 0.0%), Spaniard (83.7%, a difference of 0.0%), Bahamian (83.7%, a difference of 0.010%), Haitian (83.7%, a difference of 0.010%), and Immigrants from Haiti (83.7%, a difference of 0.020%).
| Demographics | Rating | Rank | In Labor Force | Age 25-29 |
| Cree | 0.3 /100 | #246 | Tragic 83.8% |
| Immigrants | El Salvador | 0.3 /100 | #247 | Tragic 83.7% |
| Immigrants | Nonimmigrants | 0.3 /100 | #248 | Tragic 83.7% |
| Hmong | 0.3 /100 | #249 | Tragic 83.7% |
| Central Americans | 0.2 /100 | #250 | Tragic 83.7% |
| Bahamians | 0.2 /100 | #251 | Tragic 83.7% |
| Guatemalans | 0.2 /100 | #252 | Tragic 83.7% |
| Immigrants | Trinidad and Tobago | 0.2 /100 | #253 | Tragic 83.7% |
| Spaniards | 0.2 /100 | #254 | Tragic 83.7% |
| Haitians | 0.2 /100 | #255 | Tragic 83.7% |
| Immigrants | Haiti | 0.2 /100 | #256 | Tragic 83.7% |
| Delaware | 0.2 /100 | #257 | Tragic 83.7% |
| Immigrants | Guatemala | 0.1 /100 | #258 | Tragic 83.6% |
| Spanish | 0.1 /100 | #259 | Tragic 83.6% |
| Immigrants | Bahamas | 0.1 /100 | #260 | Tragic 83.6% |