Creek vs Immigrants from Latvia Unemployment Among Ages 20 to 24 years
COMPARE
Creek
Immigrants from Latvia
Unemployment Among Ages 20 to 24 years
Unemployment Among Ages 20 to 24 years Comparison
Creek
Immigrants from Latvia
9.7%
UNEMPLOYMENT AMONG AGES 20 TO 24 YEARS
99.8/ 100
METRIC RATING
49th/ 347
METRIC RANK
10.1%
UNEMPLOYMENT AMONG AGES 20 TO 24 YEARS
93.2/ 100
METRIC RATING
108th/ 347
METRIC RANK
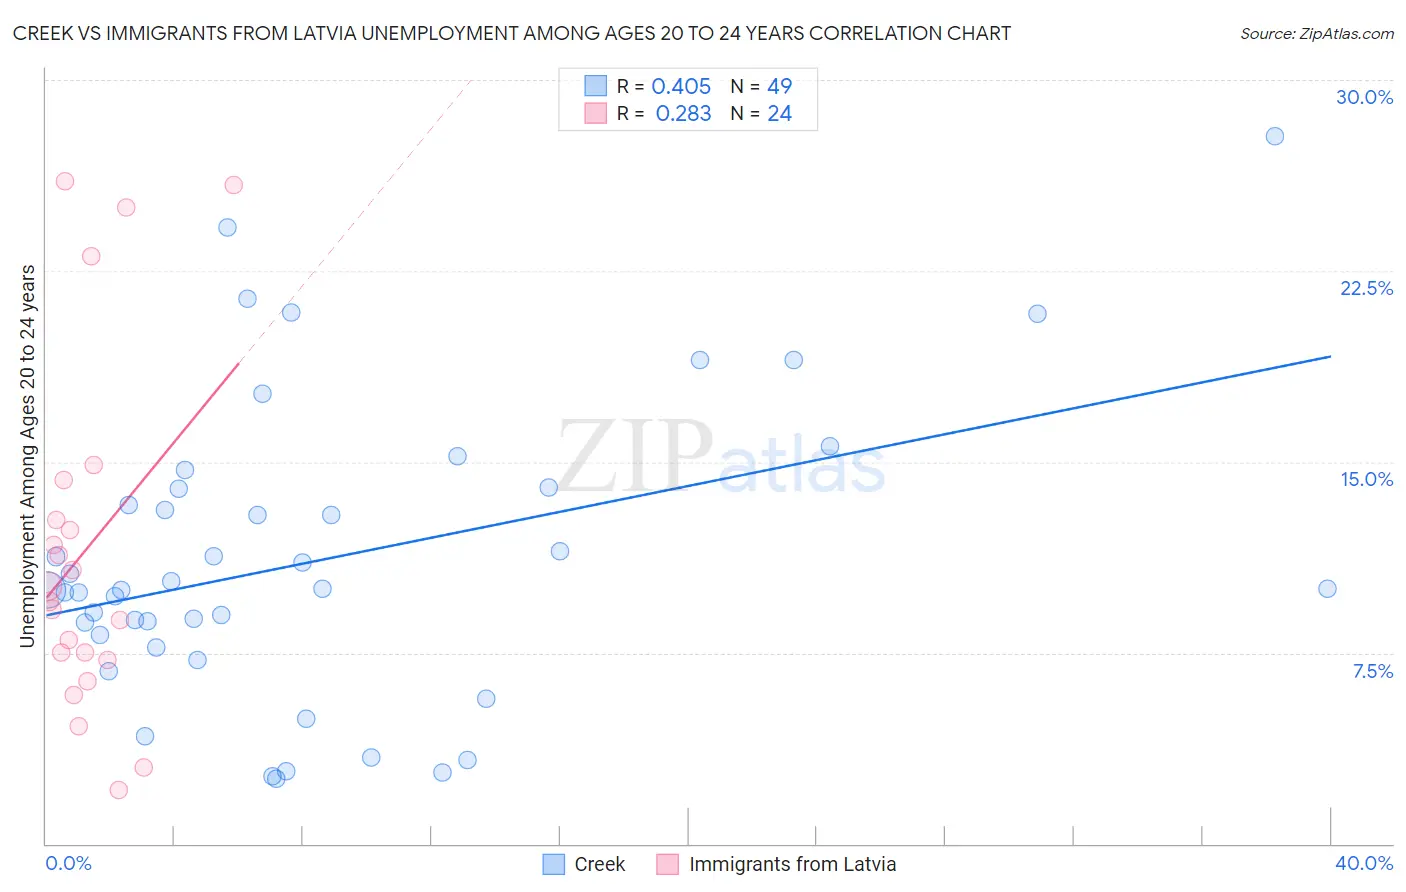
Creek vs Immigrants from Latvia Unemployment Among Ages 20 to 24 years Correlation Chart
The statistical analysis conducted on geographies consisting of 174,635,807 people shows a moderate positive correlation between the proportion of Creek and unemployment rate among population between the ages 20 and 24 in the United States with a correlation coefficient (R) of 0.405 and weighted average of 9.7%. Similarly, the statistical analysis conducted on geographies consisting of 112,554,162 people shows a weak positive correlation between the proportion of Immigrants from Latvia and unemployment rate among population between the ages 20 and 24 in the United States with a correlation coefficient (R) of 0.283 and weighted average of 10.1%, a difference of 3.4%.
Unemployment Among Ages 20 to 24 years Correlation Summary
| Measurement | Creek | Immigrants from Latvia |
| Minimum | 2.5% | 2.1% |
| Maximum | 27.8% | 26.0% |
| Range | 25.3% | 23.9% |
| Mean | 11.2% | 11.6% |
| Median | 10.0% | 9.8% |
| Interquartile 25% (IQ1) | 8.0% | 7.3% |
| Interquartile 75% (IQ3) | 14.0% | 13.5% |
| Interquartile Range (IQR) | 6.0% | 6.2% |
| Standard Deviation (Sample) | 5.8% | 6.9% |
| Standard Deviation (Population) | 5.7% | 6.8% |
Similar Demographics by Unemployment Among Ages 20 to 24 years
Demographics Similar to Creek by Unemployment Among Ages 20 to 24 years
In terms of unemployment among ages 20 to 24 years, the demographic groups most similar to Creek are Finnish (9.7%, a difference of 0.080%), Immigrants from India (9.7%, a difference of 0.090%), Immigrants from Kenya (9.7%, a difference of 0.14%), Immigrants from Nicaragua (9.7%, a difference of 0.21%), and Ethiopian (9.8%, a difference of 0.21%).
| Demographics | Rating | Rank | Unemployment Among Ages 20 to 24 years |
| Immigrants | Saudi Arabia | 99.9 /100 | #42 | Exceptional 9.7% |
| Menominee | 99.8 /100 | #43 | Exceptional 9.7% |
| Europeans | 99.8 /100 | #44 | Exceptional 9.7% |
| Croatians | 99.8 /100 | #45 | Exceptional 9.7% |
| Immigrants | Nicaragua | 99.8 /100 | #46 | Exceptional 9.7% |
| Immigrants | India | 99.8 /100 | #47 | Exceptional 9.7% |
| Finns | 99.8 /100 | #48 | Exceptional 9.7% |
| Creek | 99.8 /100 | #49 | Exceptional 9.7% |
| Immigrants | Kenya | 99.7 /100 | #50 | Exceptional 9.7% |
| Ethiopians | 99.7 /100 | #51 | Exceptional 9.8% |
| Immigrants | Thailand | 99.7 /100 | #52 | Exceptional 9.8% |
| Immigrants | Serbia | 99.6 /100 | #53 | Exceptional 9.8% |
| Immigrants | Cambodia | 99.6 /100 | #54 | Exceptional 9.8% |
| Carpatho Rusyns | 99.6 /100 | #55 | Exceptional 9.8% |
| Nicaraguans | 99.6 /100 | #56 | Exceptional 9.8% |
Demographics Similar to Immigrants from Latvia by Unemployment Among Ages 20 to 24 years
In terms of unemployment among ages 20 to 24 years, the demographic groups most similar to Immigrants from Latvia are Filipino (10.1%, a difference of 0.0%), Immigrants from Spain (10.1%, a difference of 0.010%), Iroquois (10.1%, a difference of 0.030%), Immigrants from Indonesia (10.1%, a difference of 0.070%), and Northern European (10.1%, a difference of 0.080%).
| Demographics | Rating | Rank | Unemployment Among Ages 20 to 24 years |
| Laotians | 95.1 /100 | #101 | Exceptional 10.0% |
| Immigrants | Argentina | 94.9 /100 | #102 | Exceptional 10.0% |
| Irish | 94.3 /100 | #103 | Exceptional 10.0% |
| Immigrants | Chile | 94.0 /100 | #104 | Exceptional 10.0% |
| Immigrants | Hungary | 94.0 /100 | #105 | Exceptional 10.0% |
| Pennsylvania Germans | 93.9 /100 | #106 | Exceptional 10.0% |
| Iroquois | 93.4 /100 | #107 | Exceptional 10.1% |
| Immigrants | Latvia | 93.2 /100 | #108 | Exceptional 10.1% |
| Filipinos | 93.2 /100 | #109 | Exceptional 10.1% |
| Immigrants | Spain | 93.1 /100 | #110 | Exceptional 10.1% |
| Immigrants | Indonesia | 92.7 /100 | #111 | Exceptional 10.1% |
| Northern Europeans | 92.7 /100 | #112 | Exceptional 10.1% |
| German Russians | 92.4 /100 | #113 | Exceptional 10.1% |
| Ottawa | 90.8 /100 | #114 | Exceptional 10.1% |
| Immigrants | Morocco | 90.5 /100 | #115 | Exceptional 10.1% |