Creek vs Immigrants from Afghanistan In Labor Force | Age 20-64
COMPARE
Creek
Immigrants from Afghanistan
In Labor Force | Age 20-64
In Labor Force | Age 20-64 Comparison
Creek
Immigrants from Afghanistan
75.1%
IN LABOR FORCE | AGE 20-64
0.0/ 100
METRIC RATING
326th/ 347
METRIC RANK
80.2%
IN LABOR FORCE | AGE 20-64
97.9/ 100
METRIC RATING
75th/ 347
METRIC RANK
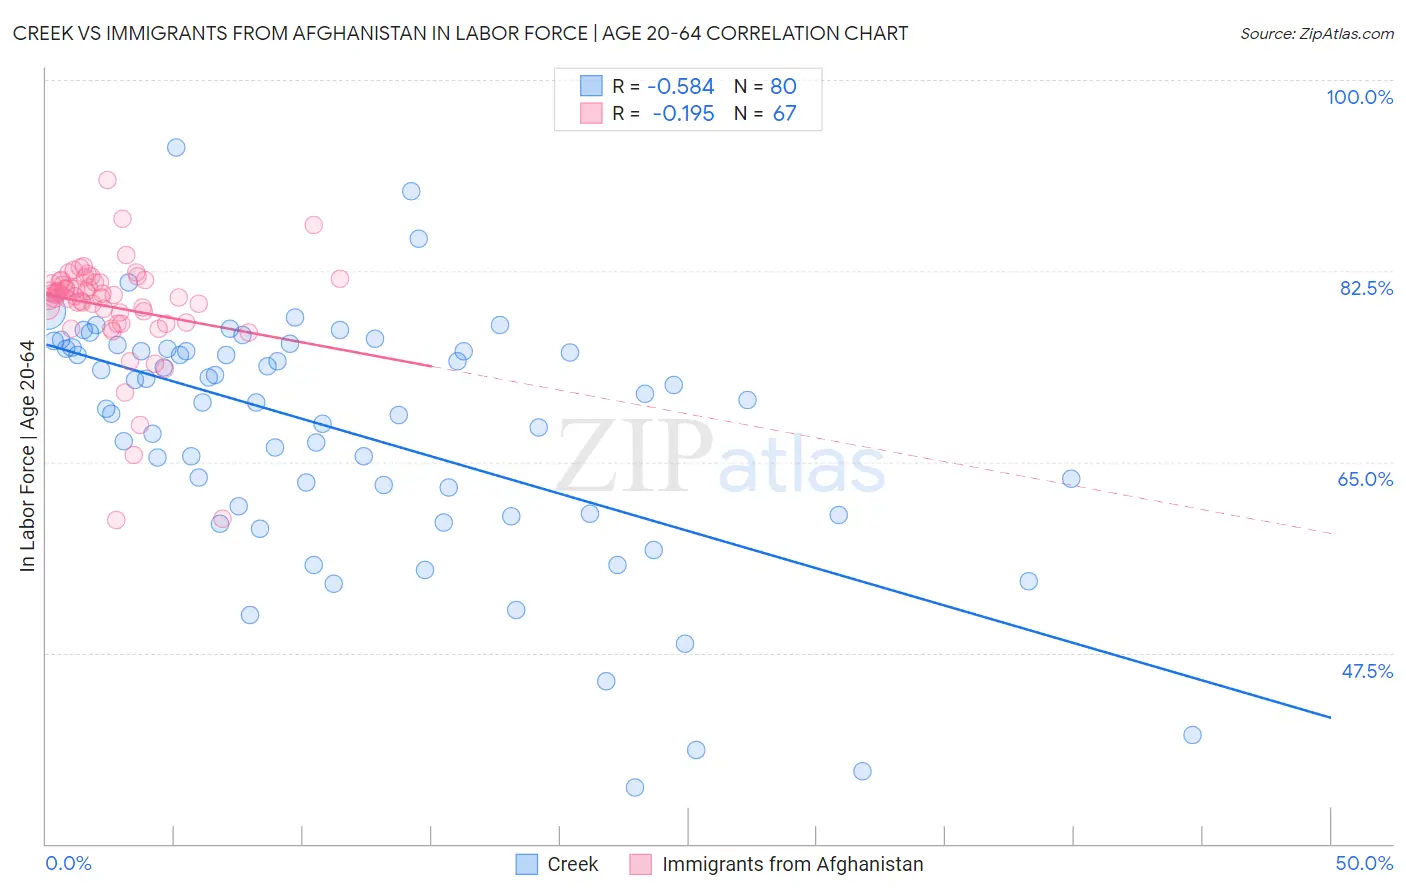
Creek vs Immigrants from Afghanistan In Labor Force | Age 20-64 Correlation Chart
The statistical analysis conducted on geographies consisting of 178,467,518 people shows a substantial negative correlation between the proportion of Creek and labor force participation rate among population between the ages 20 and 64 in the United States with a correlation coefficient (R) of -0.584 and weighted average of 75.1%. Similarly, the statistical analysis conducted on geographies consisting of 147,645,979 people shows a poor negative correlation between the proportion of Immigrants from Afghanistan and labor force participation rate among population between the ages 20 and 64 in the United States with a correlation coefficient (R) of -0.195 and weighted average of 80.2%, a difference of 6.7%.
In Labor Force | Age 20-64 Correlation Summary
| Measurement | Creek | Immigrants from Afghanistan |
| Minimum | 35.2% | 59.7% |
| Maximum | 93.8% | 90.8% |
| Range | 58.6% | 31.1% |
| Mean | 67.7% | 79.2% |
| Median | 70.6% | 80.3% |
| Interquartile 25% (IQ1) | 60.6% | 77.8% |
| Interquartile 75% (IQ3) | 75.4% | 81.5% |
| Interquartile Range (IQR) | 14.8% | 3.7% |
| Standard Deviation (Sample) | 11.5% | 5.0% |
| Standard Deviation (Population) | 11.4% | 5.0% |
Similar Demographics by In Labor Force | Age 20-64
Demographics Similar to Creek by In Labor Force | Age 20-64
In terms of in labor force | age 20-64, the demographic groups most similar to Creek are Sioux (75.0%, a difference of 0.18%), Kiowa (75.0%, a difference of 0.20%), Menominee (75.3%, a difference of 0.22%), Choctaw (75.4%, a difference of 0.36%), and Cheyenne (74.8%, a difference of 0.40%).
| Demographics | Rating | Rank | In Labor Force | Age 20-64 |
| Inupiat | 0.0 /100 | #319 | Tragic 76.1% |
| Yakama | 0.0 /100 | #320 | Tragic 75.8% |
| Seminole | 0.0 /100 | #321 | Tragic 75.5% |
| Dutch West Indians | 0.0 /100 | #322 | Tragic 75.5% |
| Cajuns | 0.0 /100 | #323 | Tragic 75.5% |
| Choctaw | 0.0 /100 | #324 | Tragic 75.4% |
| Menominee | 0.0 /100 | #325 | Tragic 75.3% |
| Creek | 0.0 /100 | #326 | Tragic 75.1% |
| Sioux | 0.0 /100 | #327 | Tragic 75.0% |
| Kiowa | 0.0 /100 | #328 | Tragic 75.0% |
| Cheyenne | 0.0 /100 | #329 | Tragic 74.8% |
| Colville | 0.0 /100 | #330 | Tragic 74.8% |
| Paiute | 0.0 /100 | #331 | Tragic 74.7% |
| Arapaho | 0.0 /100 | #332 | Tragic 74.4% |
| Natives/Alaskans | 0.0 /100 | #333 | Tragic 73.9% |
Demographics Similar to Immigrants from Afghanistan by In Labor Force | Age 20-64
In terms of in labor force | age 20-64, the demographic groups most similar to Immigrants from Afghanistan are Immigrants from Eastern Europe (80.2%, a difference of 0.010%), Egyptian (80.2%, a difference of 0.010%), Immigrants from Colombia (80.2%, a difference of 0.010%), Immigrants from Romania (80.2%, a difference of 0.010%), and Cypriot (80.2%, a difference of 0.020%).
| Demographics | Rating | Rank | In Labor Force | Age 20-64 |
| Bhutanese | 98.6 /100 | #68 | Exceptional 80.2% |
| Albanians | 98.6 /100 | #69 | Exceptional 80.2% |
| Immigrants | Turkey | 98.5 /100 | #70 | Exceptional 80.2% |
| Soviet Union | 98.5 /100 | #71 | Exceptional 80.2% |
| Eastern Europeans | 98.4 /100 | #72 | Exceptional 80.2% |
| Cypriots | 98.2 /100 | #73 | Exceptional 80.2% |
| Immigrants | Eastern Europe | 98.1 /100 | #74 | Exceptional 80.2% |
| Immigrants | Afghanistan | 97.9 /100 | #75 | Exceptional 80.2% |
| Egyptians | 97.8 /100 | #76 | Exceptional 80.2% |
| Immigrants | Colombia | 97.8 /100 | #77 | Exceptional 80.2% |
| Immigrants | Romania | 97.8 /100 | #78 | Exceptional 80.2% |
| Asians | 97.7 /100 | #79 | Exceptional 80.2% |
| Immigrants | Croatia | 97.6 /100 | #80 | Exceptional 80.1% |
| German Russians | 97.3 /100 | #81 | Exceptional 80.1% |
| Immigrants | Japan | 97.3 /100 | #82 | Exceptional 80.1% |