Spanish vs Cherokee In Labor Force | Age > 16
COMPARE
Spanish
Cherokee
In Labor Force | Age > 16
In Labor Force | Age > 16 Comparison
Spanish
Cherokee
63.9%
IN LABOR FORCE | AGE > 16
0.1/ 100
METRIC RATING
288th/ 347
METRIC RANK
61.9%
IN LABOR FORCE | AGE > 16
0.0/ 100
METRIC RATING
325th/ 347
METRIC RANK
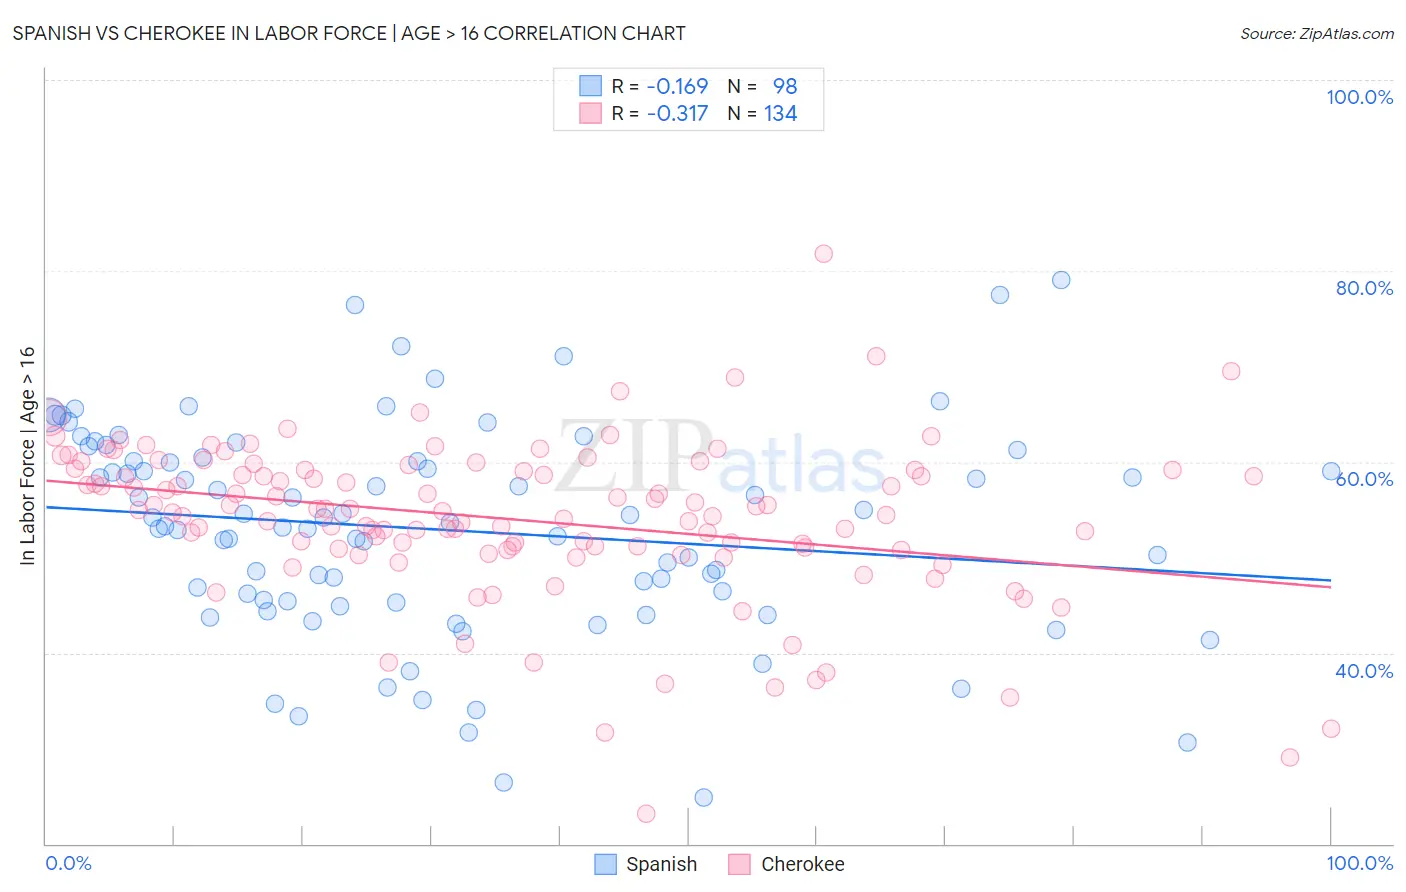
Spanish vs Cherokee In Labor Force | Age > 16 Correlation Chart
The statistical analysis conducted on geographies consisting of 422,185,482 people shows a poor negative correlation between the proportion of Spanish and labor force participation rate among population ages 16 and over in the United States with a correlation coefficient (R) of -0.169 and weighted average of 63.9%. Similarly, the statistical analysis conducted on geographies consisting of 493,683,213 people shows a mild negative correlation between the proportion of Cherokee and labor force participation rate among population ages 16 and over in the United States with a correlation coefficient (R) of -0.317 and weighted average of 61.9%, a difference of 3.1%.
In Labor Force | Age > 16 Correlation Summary
| Measurement | Spanish | Cherokee |
| Minimum | 24.8% | 23.1% |
| Maximum | 79.0% | 81.8% |
| Range | 54.2% | 58.7% |
| Mean | 52.9% | 54.0% |
| Median | 53.5% | 54.9% |
| Interquartile 25% (IQ1) | 45.4% | 50.9% |
| Interquartile 75% (IQ3) | 60.1% | 59.1% |
| Interquartile Range (IQR) | 14.7% | 8.2% |
| Standard Deviation (Sample) | 11.0% | 8.4% |
| Standard Deviation (Population) | 11.0% | 8.4% |
Similar Demographics by In Labor Force | Age > 16
Demographics Similar to Spanish by In Labor Force | Age > 16
In terms of in labor force | age > 16, the demographic groups most similar to Spanish are Celtic (63.8%, a difference of 0.030%), Immigrants from Austria (63.9%, a difference of 0.050%), Scottish (63.9%, a difference of 0.050%), Hungarian (63.8%, a difference of 0.060%), and Slovak (63.9%, a difference of 0.070%).
| Demographics | Rating | Rank | In Labor Force | Age > 16 |
| French Canadians | 0.2 /100 | #281 | Tragic 64.0% |
| Immigrants | Guyana | 0.2 /100 | #282 | Tragic 64.0% |
| Immigrants | Germany | 0.1 /100 | #283 | Tragic 63.9% |
| French | 0.1 /100 | #284 | Tragic 63.9% |
| Slovaks | 0.1 /100 | #285 | Tragic 63.9% |
| Immigrants | Austria | 0.1 /100 | #286 | Tragic 63.9% |
| Scottish | 0.1 /100 | #287 | Tragic 63.9% |
| Spanish | 0.1 /100 | #288 | Tragic 63.9% |
| Celtics | 0.1 /100 | #289 | Tragic 63.8% |
| Hungarians | 0.1 /100 | #290 | Tragic 63.8% |
| Nepalese | 0.1 /100 | #291 | Tragic 63.8% |
| Spanish American Indians | 0.1 /100 | #292 | Tragic 63.8% |
| English | 0.1 /100 | #293 | Tragic 63.7% |
| Puget Sound Salish | 0.0 /100 | #294 | Tragic 63.7% |
| Immigrants | Canada | 0.0 /100 | #295 | Tragic 63.7% |
Demographics Similar to Cherokee by In Labor Force | Age > 16
In terms of in labor force | age > 16, the demographic groups most similar to Cherokee are Cheyenne (62.0%, a difference of 0.050%), Seminole (62.0%, a difference of 0.090%), Ottawa (62.0%, a difference of 0.11%), Sioux (61.8%, a difference of 0.17%), and American (62.1%, a difference of 0.27%).
| Demographics | Rating | Rank | In Labor Force | Age > 16 |
| Chickasaw | 0.0 /100 | #318 | Tragic 62.3% |
| Arapaho | 0.0 /100 | #319 | Tragic 62.1% |
| Yakama | 0.0 /100 | #320 | Tragic 62.1% |
| Americans | 0.0 /100 | #321 | Tragic 62.1% |
| Ottawa | 0.0 /100 | #322 | Tragic 62.0% |
| Seminole | 0.0 /100 | #323 | Tragic 62.0% |
| Cheyenne | 0.0 /100 | #324 | Tragic 62.0% |
| Cherokee | 0.0 /100 | #325 | Tragic 61.9% |
| Sioux | 0.0 /100 | #326 | Tragic 61.8% |
| Cajuns | 0.0 /100 | #327 | Tragic 61.8% |
| Dutch West Indians | 0.0 /100 | #328 | Tragic 61.7% |
| Choctaw | 0.0 /100 | #329 | Tragic 61.5% |
| Creek | 0.0 /100 | #330 | Tragic 61.3% |
| Ute | 0.0 /100 | #331 | Tragic 60.9% |
| Crow | 0.0 /100 | #332 | Tragic 60.8% |