Comanche vs Romanian 9th Grade
COMPARE
Comanche
Romanian
9th Grade
9th Grade Comparison
Comanche
Romanians
94.6%
9TH GRADE
14.9/ 100
METRIC RATING
209th/ 347
METRIC RANK
95.7%
9TH GRADE
99.3/ 100
METRIC RATING
79th/ 347
METRIC RANK
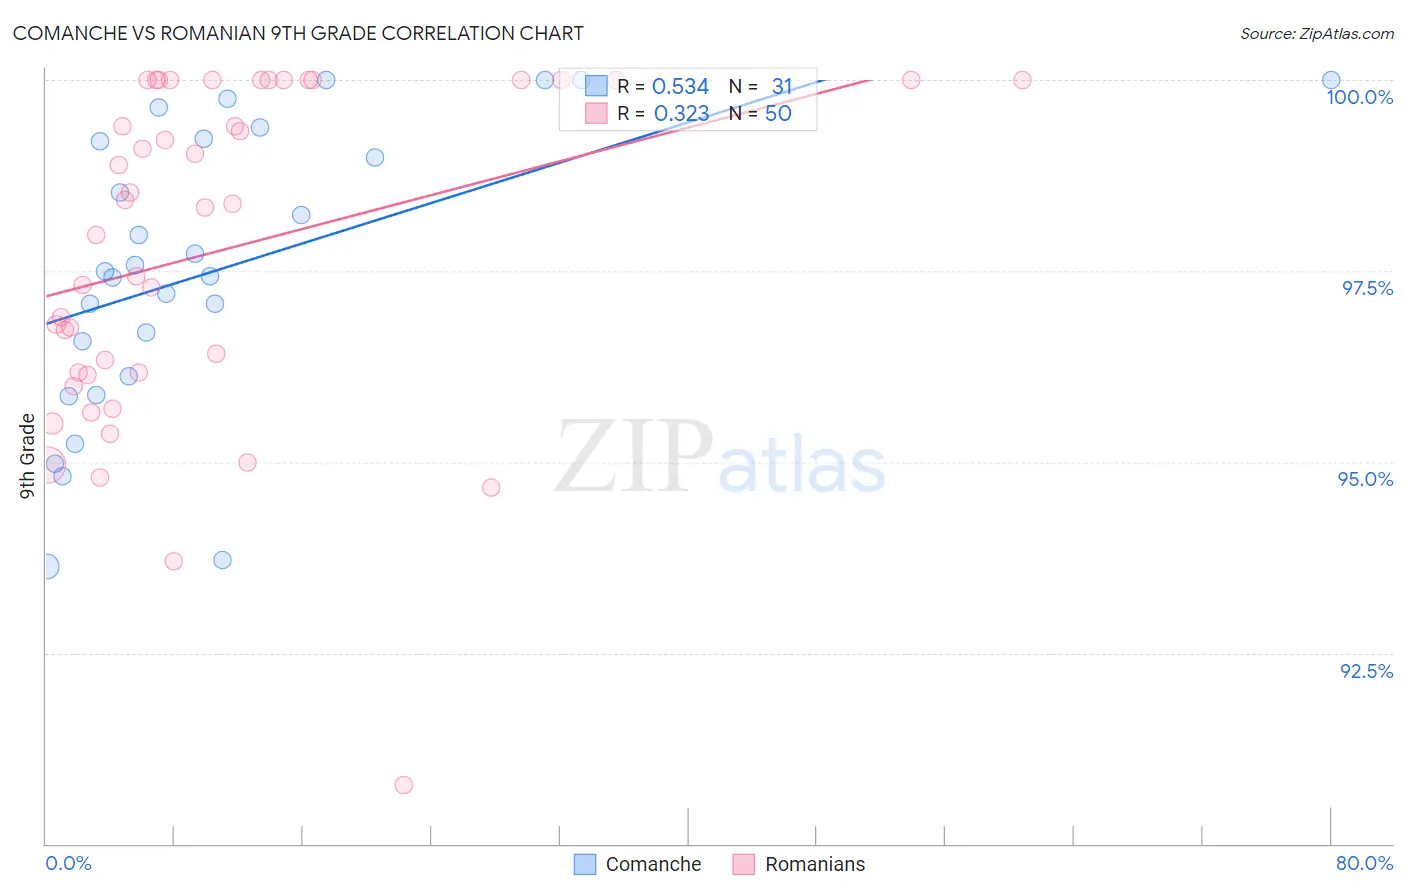
Comanche vs Romanian 9th Grade Correlation Chart
The statistical analysis conducted on geographies consisting of 109,786,530 people shows a substantial positive correlation between the proportion of Comanche and percentage of population with at least 9th grade education in the United States with a correlation coefficient (R) of 0.534 and weighted average of 94.6%. Similarly, the statistical analysis conducted on geographies consisting of 377,904,438 people shows a mild positive correlation between the proportion of Romanians and percentage of population with at least 9th grade education in the United States with a correlation coefficient (R) of 0.323 and weighted average of 95.7%, a difference of 1.2%.
9th Grade Correlation Summary
| Measurement | Comanche | Romanian |
| Minimum | 93.6% | 90.8% |
| Maximum | 100.0% | 100.0% |
| Range | 6.4% | 9.2% |
| Mean | 97.5% | 97.8% |
| Median | 97.5% | 98.4% |
| Interquartile 25% (IQ1) | 96.1% | 96.2% |
| Interquartile 75% (IQ3) | 99.2% | 100.0% |
| Interquartile Range (IQR) | 3.1% | 3.8% |
| Standard Deviation (Sample) | 1.9% | 2.2% |
| Standard Deviation (Population) | 1.8% | 2.1% |
Similar Demographics by 9th Grade
Demographics Similar to Comanche by 9th Grade
In terms of 9th grade, the demographic groups most similar to Comanche are Immigrants from Pakistan (94.6%, a difference of 0.010%), Immigrants from Morocco (94.6%, a difference of 0.020%), Immigrants from Chile (94.5%, a difference of 0.020%), Samoan (94.6%, a difference of 0.030%), and Immigrants from Sudan (94.6%, a difference of 0.040%).
| Demographics | Rating | Rank | 9th Grade |
| Immigrants | Eastern Asia | 19.8 /100 | #202 | Poor 94.6% |
| Immigrants | Bahamas | 19.8 /100 | #203 | Poor 94.6% |
| Moroccans | 19.6 /100 | #204 | Poor 94.6% |
| Immigrants | Sudan | 17.6 /100 | #205 | Poor 94.6% |
| Samoans | 17.3 /100 | #206 | Poor 94.6% |
| Immigrants | Morocco | 16.3 /100 | #207 | Poor 94.6% |
| Immigrants | Pakistan | 15.5 /100 | #208 | Poor 94.6% |
| Comanche | 14.9 /100 | #209 | Poor 94.6% |
| Immigrants | Chile | 13.4 /100 | #210 | Poor 94.5% |
| Immigrants | Indonesia | 12.3 /100 | #211 | Poor 94.5% |
| Immigrants | Malaysia | 12.2 /100 | #212 | Poor 94.5% |
| Immigrants | Oceania | 12.1 /100 | #213 | Poor 94.5% |
| Immigrants | Liberia | 11.8 /100 | #214 | Poor 94.5% |
| Immigrants | Syria | 11.0 /100 | #215 | Poor 94.5% |
| Immigrants | Western Asia | 10.7 /100 | #216 | Poor 94.5% |
Demographics Similar to Romanians by 9th Grade
In terms of 9th grade, the demographic groups most similar to Romanians are Bhutanese (95.7%, a difference of 0.020%), Arapaho (95.7%, a difference of 0.020%), Puget Sound Salish (95.7%, a difference of 0.020%), White/Caucasian (95.8%, a difference of 0.030%), and Immigrants from South Africa (95.8%, a difference of 0.030%).
| Demographics | Rating | Rank | 9th Grade |
| Turks | 99.5 /100 | #72 | Exceptional 95.8% |
| Immigrants | Singapore | 99.5 /100 | #73 | Exceptional 95.8% |
| Thais | 99.5 /100 | #74 | Exceptional 95.8% |
| Inupiat | 99.5 /100 | #75 | Exceptional 95.8% |
| Immigrants | Sweden | 99.5 /100 | #76 | Exceptional 95.8% |
| Whites/Caucasians | 99.4 /100 | #77 | Exceptional 95.8% |
| Immigrants | South Africa | 99.4 /100 | #78 | Exceptional 95.8% |
| Romanians | 99.3 /100 | #79 | Exceptional 95.7% |
| Bhutanese | 99.3 /100 | #80 | Exceptional 95.7% |
| Arapaho | 99.3 /100 | #81 | Exceptional 95.7% |
| Puget Sound Salish | 99.2 /100 | #82 | Exceptional 95.7% |
| Swiss | 99.2 /100 | #83 | Exceptional 95.7% |
| Immigrants | Denmark | 99.1 /100 | #84 | Exceptional 95.7% |
| Icelanders | 99.1 /100 | #85 | Exceptional 95.7% |
| Immigrants | Western Europe | 99.1 /100 | #86 | Exceptional 95.7% |