Hungarian vs Romanian In Labor Force | Age 30-34
COMPARE
Hungarian
Romanian
In Labor Force | Age 30-34
In Labor Force | Age 30-34 Comparison
Hungarians
Romanians
84.5%
IN LABOR FORCE | AGE 30-34
24.8/ 100
METRIC RATING
191st/ 347
METRIC RANK
84.8%
IN LABOR FORCE | AGE 30-34
73.5/ 100
METRIC RATING
152nd/ 347
METRIC RANK
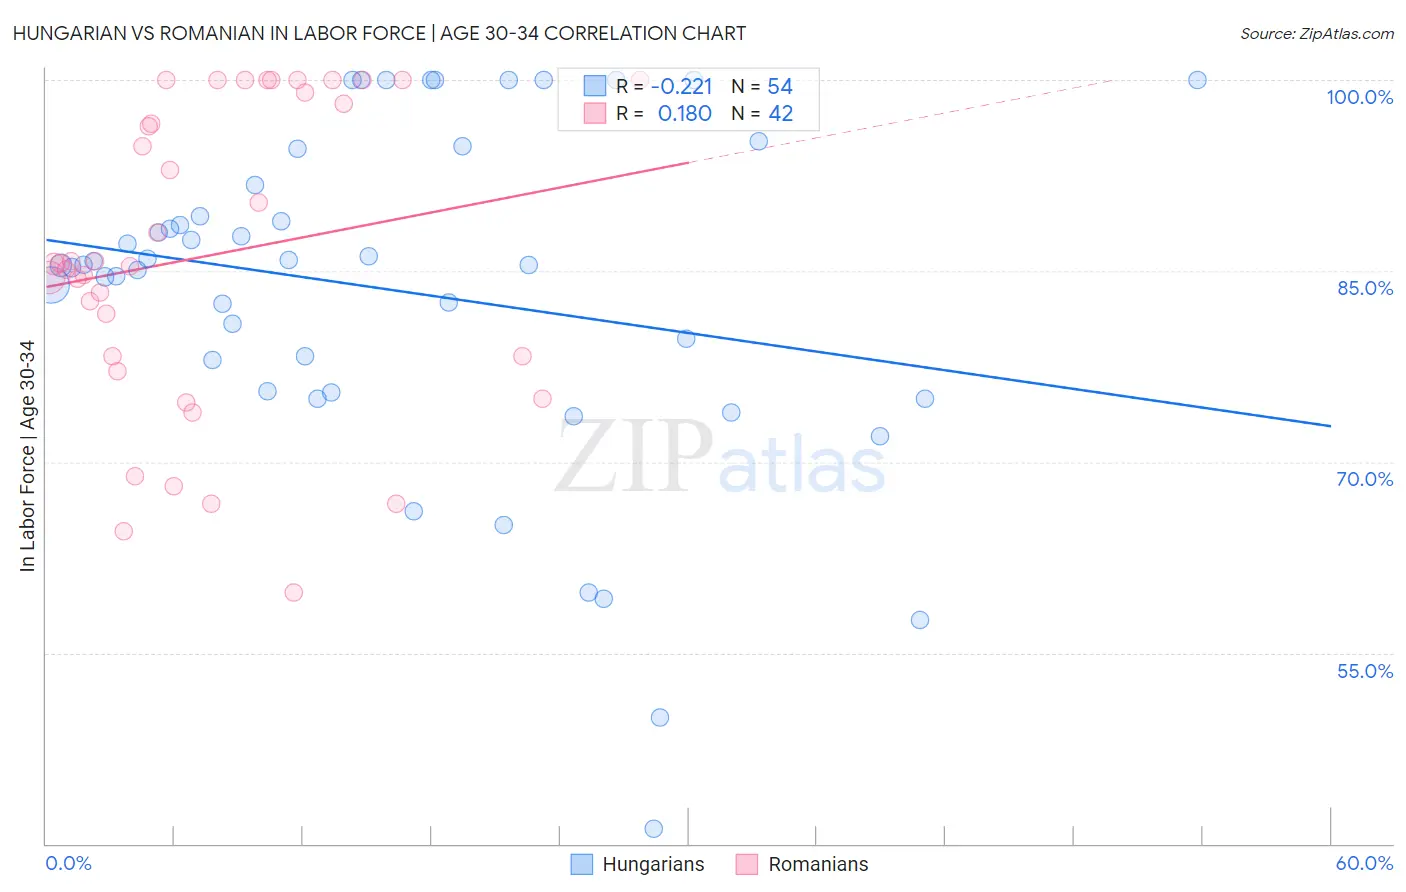
Hungarian vs Romanian In Labor Force | Age 30-34 Correlation Chart
The statistical analysis conducted on geographies consisting of 485,743,554 people shows a weak negative correlation between the proportion of Hungarians and labor force participation rate among population between the ages 30 and 34 in the United States with a correlation coefficient (R) of -0.221 and weighted average of 84.5%. Similarly, the statistical analysis conducted on geographies consisting of 377,700,007 people shows a poor positive correlation between the proportion of Romanians and labor force participation rate among population between the ages 30 and 34 in the United States with a correlation coefficient (R) of 0.180 and weighted average of 84.8%, a difference of 0.37%.
In Labor Force | Age 30-34 Correlation Summary
| Measurement | Hungarian | Romanian |
| Minimum | 41.2% | 59.7% |
| Maximum | 100.0% | 100.0% |
| Range | 58.8% | 40.3% |
| Mean | 83.5% | 86.2% |
| Median | 85.5% | 85.6% |
| Interquartile 25% (IQ1) | 75.6% | 78.3% |
| Interquartile 75% (IQ3) | 91.7% | 99.0% |
| Interquartile Range (IQR) | 16.1% | 20.7% |
| Standard Deviation (Sample) | 13.4% | 11.9% |
| Standard Deviation (Population) | 13.2% | 11.7% |
Similar Demographics by In Labor Force | Age 30-34
Demographics Similar to Hungarians by In Labor Force | Age 30-34
In terms of in labor force | age 30-34, the demographic groups most similar to Hungarians are Scandinavian (84.5%, a difference of 0.0%), Immigrants from Zaire (84.5%, a difference of 0.010%), Immigrants from Costa Rica (84.5%, a difference of 0.010%), Immigrants from Afghanistan (84.5%, a difference of 0.010%), and Korean (84.5%, a difference of 0.020%).
| Demographics | Rating | Rank | In Labor Force | Age 30-34 |
| Immigrants | North America | 33.3 /100 | #184 | Fair 84.6% |
| Immigrants | Philippines | 31.5 /100 | #185 | Fair 84.6% |
| Immigrants | Congo | 29.7 /100 | #186 | Fair 84.6% |
| Costa Ricans | 29.6 /100 | #187 | Fair 84.6% |
| Taiwanese | 29.4 /100 | #188 | Fair 84.6% |
| Nigerians | 28.9 /100 | #189 | Fair 84.5% |
| Immigrants | Zaire | 25.8 /100 | #190 | Fair 84.5% |
| Hungarians | 24.8 /100 | #191 | Fair 84.5% |
| Scandinavians | 24.7 /100 | #192 | Fair 84.5% |
| Immigrants | Costa Rica | 23.9 /100 | #193 | Fair 84.5% |
| Immigrants | Afghanistan | 23.5 /100 | #194 | Fair 84.5% |
| Koreans | 23.2 /100 | #195 | Fair 84.5% |
| British | 22.9 /100 | #196 | Fair 84.5% |
| Immigrants | Syria | 21.9 /100 | #197 | Fair 84.5% |
| Dutch | 20.2 /100 | #198 | Fair 84.5% |
Demographics Similar to Romanians by In Labor Force | Age 30-34
In terms of in labor force | age 30-34, the demographic groups most similar to Romanians are Immigrants from Senegal (84.8%, a difference of 0.0%), German (84.8%, a difference of 0.010%), Immigrants from Ukraine (84.8%, a difference of 0.020%), Immigrants from Saudi Arabia (84.9%, a difference of 0.030%), and Immigrants from Colombia (84.9%, a difference of 0.030%).
| Demographics | Rating | Rank | In Labor Force | Age 30-34 |
| Palestinians | 77.7 /100 | #145 | Good 84.9% |
| Immigrants | Saudi Arabia | 76.6 /100 | #146 | Good 84.9% |
| Immigrants | Colombia | 76.3 /100 | #147 | Good 84.9% |
| Immigrants | Pakistan | 76.2 /100 | #148 | Good 84.9% |
| Immigrants | Ukraine | 75.1 /100 | #149 | Good 84.8% |
| Germans | 75.1 /100 | #150 | Good 84.8% |
| Immigrants | Senegal | 74.0 /100 | #151 | Good 84.8% |
| Romanians | 73.5 /100 | #152 | Good 84.8% |
| Syrians | 70.1 /100 | #153 | Good 84.8% |
| Northern Europeans | 70.0 /100 | #154 | Good 84.8% |
| Immigrants | Sudan | 69.5 /100 | #155 | Good 84.8% |
| French Canadians | 67.3 /100 | #156 | Good 84.8% |
| Peruvians | 65.9 /100 | #157 | Good 84.8% |
| Immigrants | Armenia | 64.7 /100 | #158 | Good 84.8% |
| Czechoslovakians | 63.0 /100 | #159 | Good 84.8% |