West Indian vs Immigrants from Moldova In Labor Force | Age 25-29
COMPARE
West Indian
Immigrants from Moldova
In Labor Force | Age 25-29
In Labor Force | Age 25-29 Comparison
West Indians
Immigrants from Moldova
83.5%
IN LABOR FORCE | AGE 25-29
0.1/ 100
METRIC RATING
263rd/ 347
METRIC RANK
85.1%
IN LABOR FORCE | AGE 25-29
95.8/ 100
METRIC RATING
91st/ 347
METRIC RANK
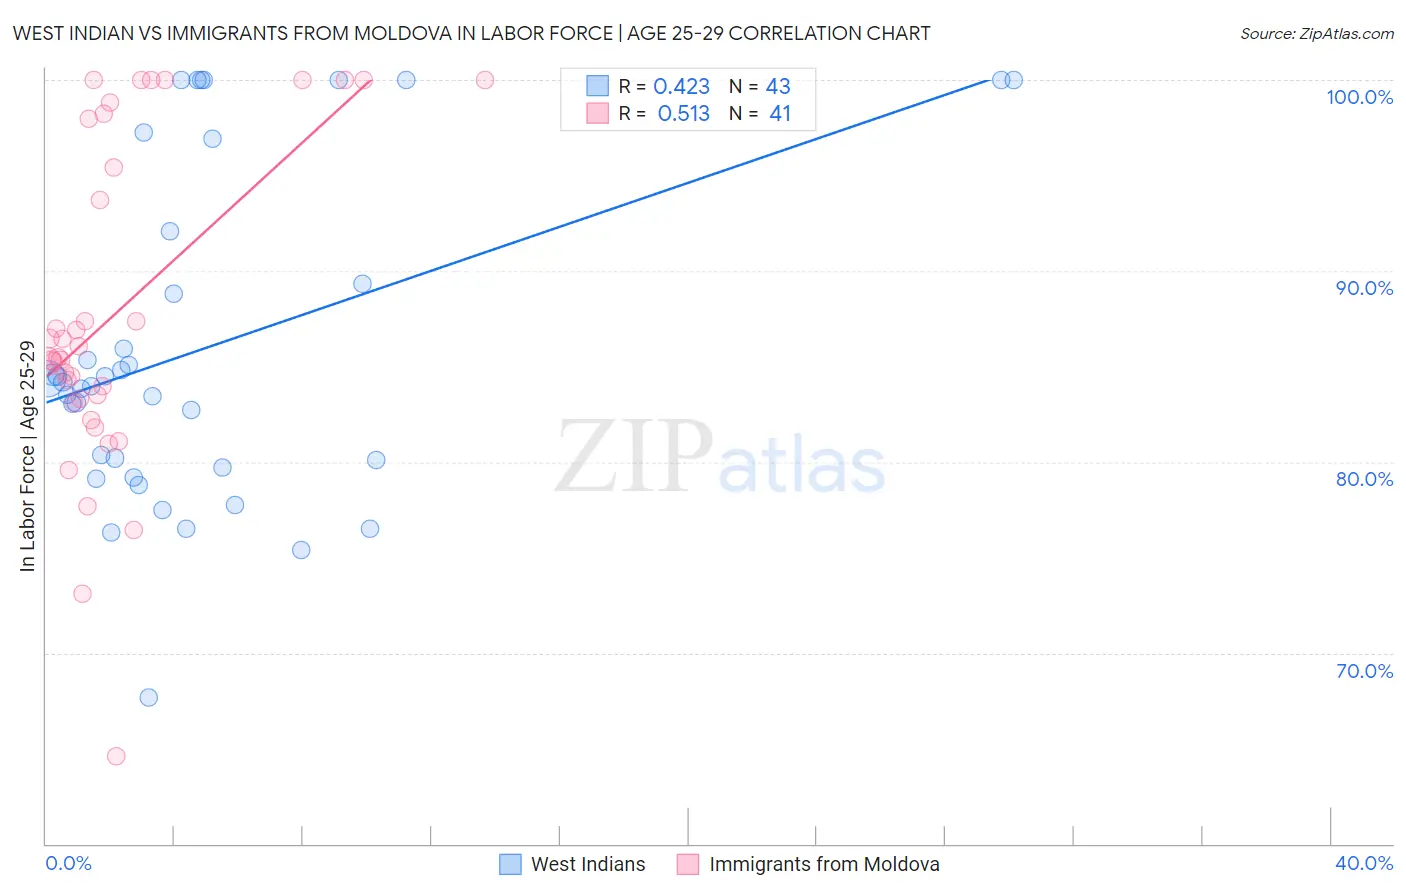
West Indian vs Immigrants from Moldova In Labor Force | Age 25-29 Correlation Chart
The statistical analysis conducted on geographies consisting of 254,002,174 people shows a moderate positive correlation between the proportion of West Indians and labor force participation rate among population between the ages 25 and 29 in the United States with a correlation coefficient (R) of 0.423 and weighted average of 83.5%. Similarly, the statistical analysis conducted on geographies consisting of 124,394,056 people shows a substantial positive correlation between the proportion of Immigrants from Moldova and labor force participation rate among population between the ages 25 and 29 in the United States with a correlation coefficient (R) of 0.513 and weighted average of 85.1%, a difference of 1.9%.
In Labor Force | Age 25-29 Correlation Summary
| Measurement | West Indian | Immigrants from Moldova |
| Minimum | 67.7% | 64.6% |
| Maximum | 100.0% | 100.0% |
| Range | 32.3% | 35.4% |
| Mean | 86.0% | 87.9% |
| Median | 84.2% | 85.5% |
| Interquartile 25% (IQ1) | 79.7% | 83.2% |
| Interquartile 75% (IQ3) | 92.1% | 98.1% |
| Interquartile Range (IQR) | 12.4% | 14.9% |
| Standard Deviation (Sample) | 8.6% | 8.6% |
| Standard Deviation (Population) | 8.5% | 8.5% |
Similar Demographics by In Labor Force | Age 25-29
Demographics Similar to West Indians by In Labor Force | Age 25-29
In terms of in labor force | age 25-29, the demographic groups most similar to West Indians are Immigrants from Fiji (83.6%, a difference of 0.040%), Puget Sound Salish (83.5%, a difference of 0.060%), Cuban (83.5%, a difference of 0.060%), Aleut (83.4%, a difference of 0.10%), and Immigrants from Bahamas (83.6%, a difference of 0.11%).
| Demographics | Rating | Rank | In Labor Force | Age 25-29 |
| Immigrants | Haiti | 0.2 /100 | #256 | Tragic 83.7% |
| Delaware | 0.2 /100 | #257 | Tragic 83.7% |
| Immigrants | Guatemala | 0.1 /100 | #258 | Tragic 83.6% |
| Spanish | 0.1 /100 | #259 | Tragic 83.6% |
| Immigrants | Bahamas | 0.1 /100 | #260 | Tragic 83.6% |
| Pennsylvania Germans | 0.1 /100 | #261 | Tragic 83.6% |
| Immigrants | Fiji | 0.1 /100 | #262 | Tragic 83.6% |
| West Indians | 0.1 /100 | #263 | Tragic 83.5% |
| Puget Sound Salish | 0.1 /100 | #264 | Tragic 83.5% |
| Cubans | 0.1 /100 | #265 | Tragic 83.5% |
| Aleuts | 0.0 /100 | #266 | Tragic 83.4% |
| Spanish Americans | 0.0 /100 | #267 | Tragic 83.4% |
| Immigrants | Lebanon | 0.0 /100 | #268 | Tragic 83.4% |
| Immigrants | Barbados | 0.0 /100 | #269 | Tragic 83.4% |
| Basques | 0.0 /100 | #270 | Tragic 83.4% |
Demographics Similar to Immigrants from Moldova by In Labor Force | Age 25-29
In terms of in labor force | age 25-29, the demographic groups most similar to Immigrants from Moldova are Burmese (85.1%, a difference of 0.010%), Immigrants from Costa Rica (85.1%, a difference of 0.010%), Austrian (85.1%, a difference of 0.020%), Immigrants from Croatia (85.2%, a difference of 0.030%), and Immigrants from France (85.2%, a difference of 0.030%).
| Demographics | Rating | Rank | In Labor Force | Age 25-29 |
| Immigrants | Eastern Europe | 96.8 /100 | #84 | Exceptional 85.2% |
| Immigrants | Africa | 96.7 /100 | #85 | Exceptional 85.2% |
| Ukrainians | 96.7 /100 | #86 | Exceptional 85.2% |
| French Canadians | 96.5 /100 | #87 | Exceptional 85.2% |
| Immigrants | Croatia | 96.4 /100 | #88 | Exceptional 85.2% |
| Immigrants | France | 96.3 /100 | #89 | Exceptional 85.2% |
| Burmese | 95.9 /100 | #90 | Exceptional 85.1% |
| Immigrants | Moldova | 95.8 /100 | #91 | Exceptional 85.1% |
| Immigrants | Costa Rica | 95.5 /100 | #92 | Exceptional 85.1% |
| Austrians | 95.3 /100 | #93 | Exceptional 85.1% |
| Immigrants | Korea | 94.8 /100 | #94 | Exceptional 85.1% |
| Immigrants | Netherlands | 94.6 /100 | #95 | Exceptional 85.1% |
| Immigrants | Romania | 94.6 /100 | #96 | Exceptional 85.1% |
| Immigrants | Sudan | 94.3 /100 | #97 | Exceptional 85.1% |
| Mongolians | 94.1 /100 | #98 | Exceptional 85.1% |