Alsatian vs Immigrants from Moldova In Labor Force | Age 25-29
COMPARE
Alsatian
Immigrants from Moldova
In Labor Force | Age 25-29
In Labor Force | Age 25-29 Comparison
Alsatians
Immigrants from Moldova
83.9%
IN LABOR FORCE | AGE 25-29
0.7/ 100
METRIC RATING
241st/ 347
METRIC RANK
85.1%
IN LABOR FORCE | AGE 25-29
95.8/ 100
METRIC RATING
91st/ 347
METRIC RANK
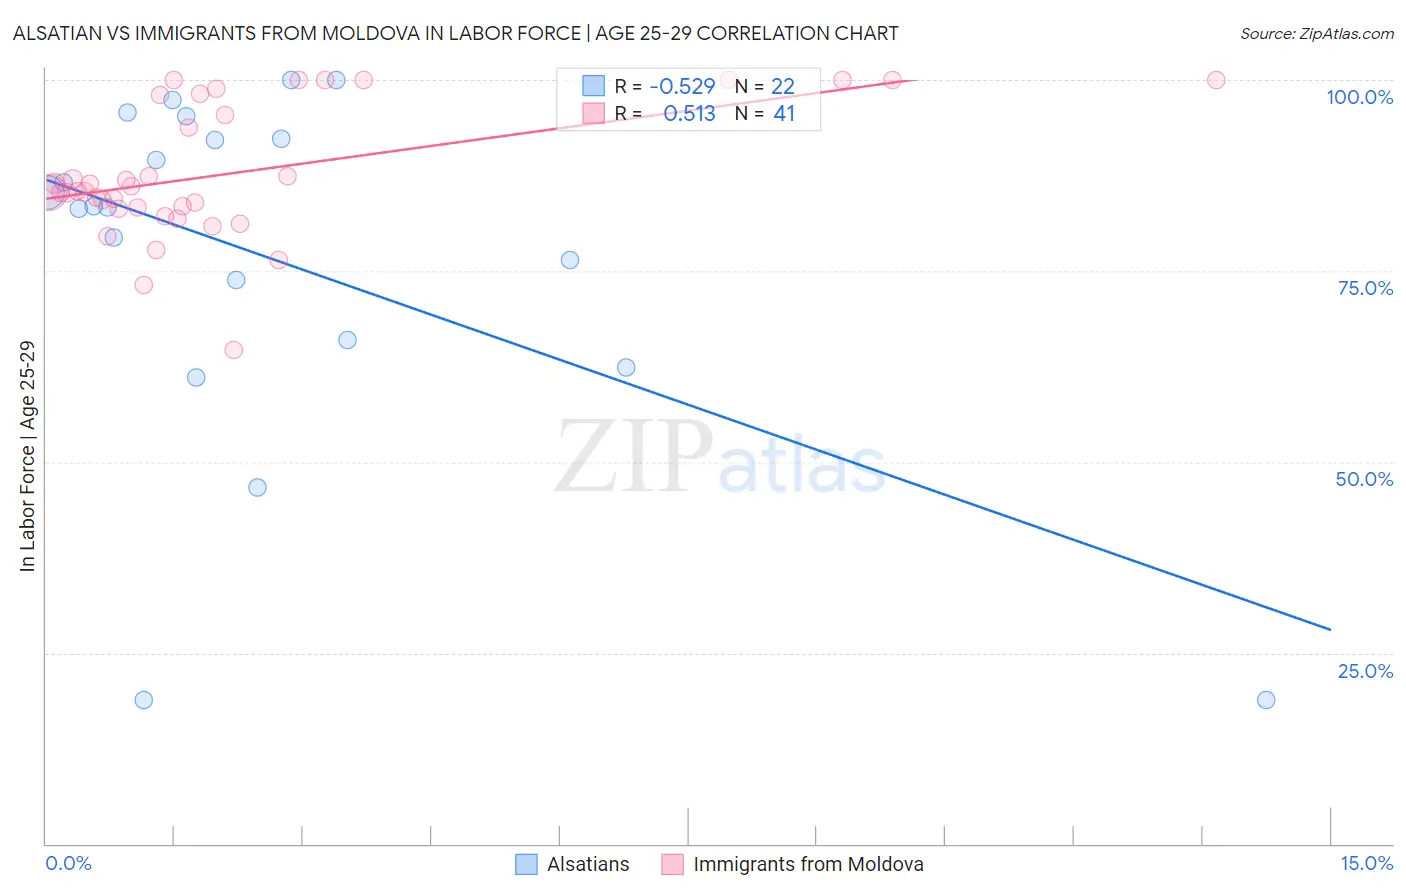
Alsatian vs Immigrants from Moldova In Labor Force | Age 25-29 Correlation Chart
The statistical analysis conducted on geographies consisting of 82,674,236 people shows a substantial negative correlation between the proportion of Alsatians and labor force participation rate among population between the ages 25 and 29 in the United States with a correlation coefficient (R) of -0.529 and weighted average of 83.9%. Similarly, the statistical analysis conducted on geographies consisting of 124,394,056 people shows a substantial positive correlation between the proportion of Immigrants from Moldova and labor force participation rate among population between the ages 25 and 29 in the United States with a correlation coefficient (R) of 0.513 and weighted average of 85.1%, a difference of 1.5%.
In Labor Force | Age 25-29 Correlation Summary
| Measurement | Alsatian | Immigrants from Moldova |
| Minimum | 18.8% | 64.6% |
| Maximum | 100.0% | 100.0% |
| Range | 81.2% | 35.4% |
| Mean | 76.7% | 87.9% |
| Median | 83.4% | 85.5% |
| Interquartile 25% (IQ1) | 66.0% | 83.2% |
| Interquartile 75% (IQ3) | 92.3% | 98.1% |
| Interquartile Range (IQR) | 26.3% | 14.9% |
| Standard Deviation (Sample) | 23.2% | 8.6% |
| Standard Deviation (Population) | 22.7% | 8.5% |
Similar Demographics by In Labor Force | Age 25-29
Demographics Similar to Alsatians by In Labor Force | Age 25-29
In terms of in labor force | age 25-29, the demographic groups most similar to Alsatians are Trinidadian and Tobagonian (83.9%, a difference of 0.020%), Immigrants from Uzbekistan (83.9%, a difference of 0.030%), Jamaican (83.9%, a difference of 0.030%), U.S. Virgin Islander (83.8%, a difference of 0.030%), and Salvadoran (83.8%, a difference of 0.040%).
| Demographics | Rating | Rank | In Labor Force | Age 25-29 |
| Barbadians | 1.0 /100 | #234 | Tragic 83.9% |
| Iraqis | 0.9 /100 | #235 | Tragic 83.9% |
| Guamanians/Chamorros | 0.9 /100 | #236 | Tragic 83.9% |
| Immigrants | Immigrants | 0.9 /100 | #237 | Tragic 83.9% |
| Immigrants | Uzbekistan | 0.8 /100 | #238 | Tragic 83.9% |
| Jamaicans | 0.8 /100 | #239 | Tragic 83.9% |
| Trinidadians and Tobagonians | 0.7 /100 | #240 | Tragic 83.9% |
| Alsatians | 0.7 /100 | #241 | Tragic 83.9% |
| U.S. Virgin Islanders | 0.6 /100 | #242 | Tragic 83.8% |
| Salvadorans | 0.5 /100 | #243 | Tragic 83.8% |
| Immigrants | Jamaica | 0.4 /100 | #244 | Tragic 83.8% |
| Iroquois | 0.4 /100 | #245 | Tragic 83.8% |
| Cree | 0.3 /100 | #246 | Tragic 83.8% |
| Immigrants | El Salvador | 0.3 /100 | #247 | Tragic 83.7% |
| Immigrants | Nonimmigrants | 0.3 /100 | #248 | Tragic 83.7% |
Demographics Similar to Immigrants from Moldova by In Labor Force | Age 25-29
In terms of in labor force | age 25-29, the demographic groups most similar to Immigrants from Moldova are Burmese (85.1%, a difference of 0.010%), Immigrants from Costa Rica (85.1%, a difference of 0.010%), Austrian (85.1%, a difference of 0.020%), Immigrants from Croatia (85.2%, a difference of 0.030%), and Immigrants from France (85.2%, a difference of 0.030%).
| Demographics | Rating | Rank | In Labor Force | Age 25-29 |
| Immigrants | Eastern Europe | 96.8 /100 | #84 | Exceptional 85.2% |
| Immigrants | Africa | 96.7 /100 | #85 | Exceptional 85.2% |
| Ukrainians | 96.7 /100 | #86 | Exceptional 85.2% |
| French Canadians | 96.5 /100 | #87 | Exceptional 85.2% |
| Immigrants | Croatia | 96.4 /100 | #88 | Exceptional 85.2% |
| Immigrants | France | 96.3 /100 | #89 | Exceptional 85.2% |
| Burmese | 95.9 /100 | #90 | Exceptional 85.1% |
| Immigrants | Moldova | 95.8 /100 | #91 | Exceptional 85.1% |
| Immigrants | Costa Rica | 95.5 /100 | #92 | Exceptional 85.1% |
| Austrians | 95.3 /100 | #93 | Exceptional 85.1% |
| Immigrants | Korea | 94.8 /100 | #94 | Exceptional 85.1% |
| Immigrants | Netherlands | 94.6 /100 | #95 | Exceptional 85.1% |
| Immigrants | Romania | 94.6 /100 | #96 | Exceptional 85.1% |
| Immigrants | Sudan | 94.3 /100 | #97 | Exceptional 85.1% |
| Mongolians | 94.1 /100 | #98 | Exceptional 85.1% |