Greek vs Chinese In Labor Force | Age 35-44
COMPARE
Greek
Chinese
In Labor Force | Age 35-44
In Labor Force | Age 35-44 Comparison
Greeks
Chinese
84.9%
IN LABOR FORCE | AGE 35-44
97.8/ 100
METRIC RATING
86th/ 347
METRIC RANK
85.1%
IN LABOR FORCE | AGE 35-44
99.4/ 100
METRIC RATING
57th/ 347
METRIC RANK
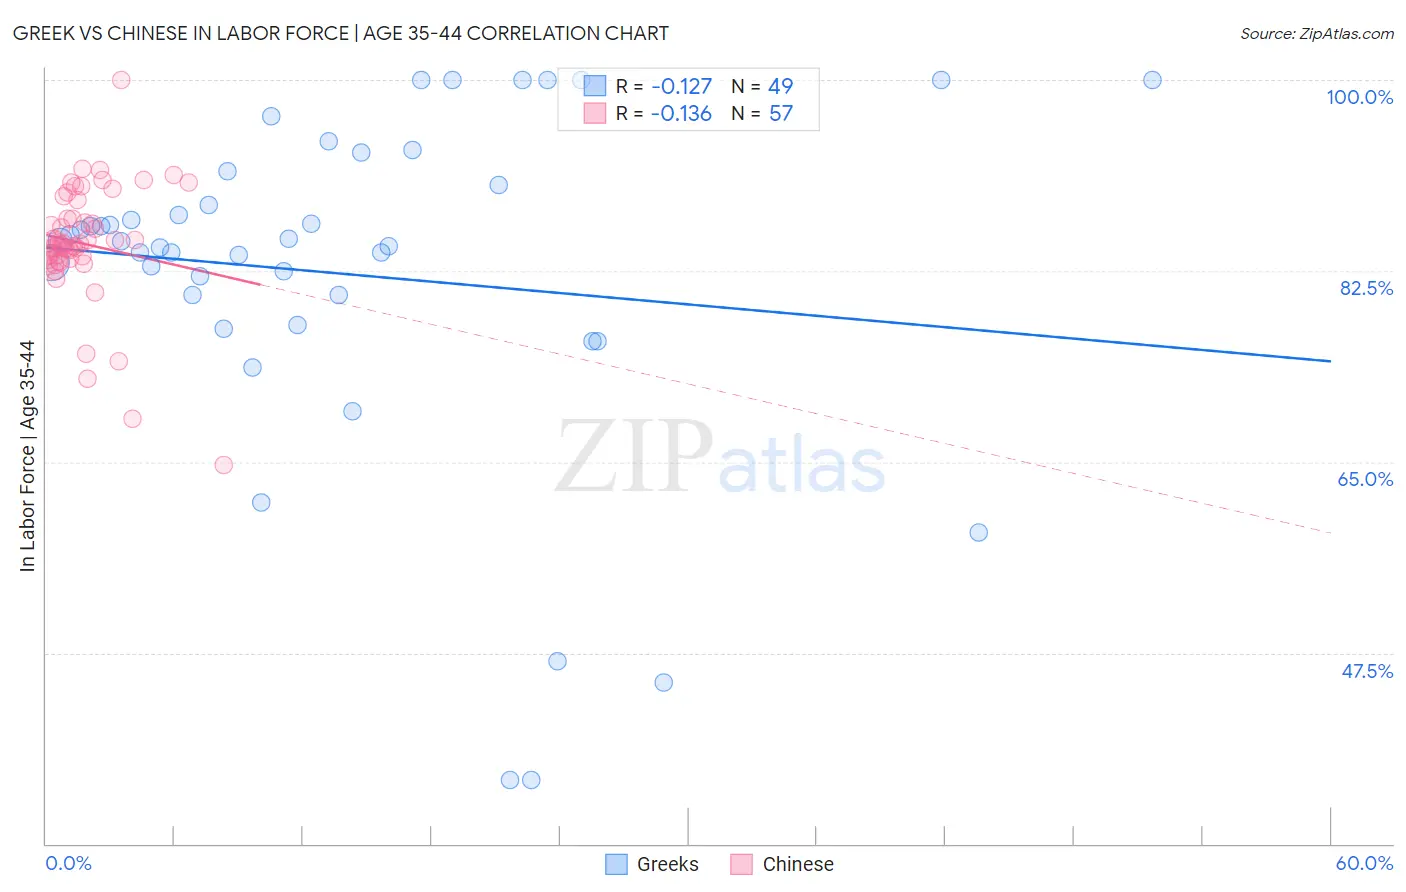
Greek vs Chinese In Labor Force | Age 35-44 Correlation Chart
The statistical analysis conducted on geographies consisting of 482,395,724 people shows a poor negative correlation between the proportion of Greeks and labor force participation rate among population between the ages 35 and 44 in the United States with a correlation coefficient (R) of -0.127 and weighted average of 84.9%. Similarly, the statistical analysis conducted on geographies consisting of 64,807,570 people shows a poor negative correlation between the proportion of Chinese and labor force participation rate among population between the ages 35 and 44 in the United States with a correlation coefficient (R) of -0.136 and weighted average of 85.1%, a difference of 0.22%.
In Labor Force | Age 35-44 Correlation Summary
| Measurement | Greek | Chinese |
| Minimum | 35.9% | 64.7% |
| Maximum | 100.0% | 100.0% |
| Range | 64.1% | 35.3% |
| Mean | 82.2% | 85.0% |
| Median | 85.2% | 85.0% |
| Interquartile 25% (IQ1) | 78.9% | 83.6% |
| Interquartile 75% (IQ3) | 91.0% | 88.2% |
| Interquartile Range (IQR) | 12.1% | 4.6% |
| Standard Deviation (Sample) | 15.5% | 5.6% |
| Standard Deviation (Population) | 15.4% | 5.6% |
Similar Demographics by In Labor Force | Age 35-44
Demographics Similar to Greeks by In Labor Force | Age 35-44
In terms of in labor force | age 35-44, the demographic groups most similar to Greeks are Senegalese (84.9%, a difference of 0.0%), Immigrants from Peru (84.9%, a difference of 0.0%), Immigrants from Middle Africa (84.9%, a difference of 0.0%), Belgian (84.9%, a difference of 0.0%), and Yugoslavian (84.9%, a difference of 0.0%).
| Demographics | Rating | Rank | In Labor Force | Age 35-44 |
| Peruvians | 98.3 /100 | #79 | Exceptional 84.9% |
| Immigrants | Colombia | 98.3 /100 | #80 | Exceptional 84.9% |
| Immigrants | Eastern Europe | 98.3 /100 | #81 | Exceptional 84.9% |
| Immigrants | Sudan | 98.1 /100 | #82 | Exceptional 84.9% |
| Senegalese | 97.8 /100 | #83 | Exceptional 84.9% |
| Immigrants | Peru | 97.8 /100 | #84 | Exceptional 84.9% |
| Immigrants | Middle Africa | 97.8 /100 | #85 | Exceptional 84.9% |
| Greeks | 97.8 /100 | #86 | Exceptional 84.9% |
| Belgians | 97.7 /100 | #87 | Exceptional 84.9% |
| Yugoslavians | 97.7 /100 | #88 | Exceptional 84.9% |
| Immigrants | Pakistan | 97.5 /100 | #89 | Exceptional 84.9% |
| Immigrants | France | 97.4 /100 | #90 | Exceptional 84.9% |
| Immigrants | Europe | 97.2 /100 | #91 | Exceptional 84.9% |
| Ghanaians | 97.2 /100 | #92 | Exceptional 84.8% |
| Immigrants | Northern Africa | 97.1 /100 | #93 | Exceptional 84.8% |
Demographics Similar to Chinese by In Labor Force | Age 35-44
In terms of in labor force | age 35-44, the demographic groups most similar to Chinese are Slovak (85.1%, a difference of 0.010%), Serbian (85.1%, a difference of 0.010%), Albanian (85.1%, a difference of 0.010%), Immigrants from Croatia (85.1%, a difference of 0.020%), and Turkish (85.1%, a difference of 0.030%).
| Demographics | Rating | Rank | In Labor Force | Age 35-44 |
| Thais | 99.7 /100 | #50 | Exceptional 85.2% |
| Immigrants | Albania | 99.7 /100 | #51 | Exceptional 85.1% |
| Immigrants | Kenya | 99.6 /100 | #52 | Exceptional 85.1% |
| Taiwanese | 99.6 /100 | #53 | Exceptional 85.1% |
| Turks | 99.5 /100 | #54 | Exceptional 85.1% |
| Soviet Union | 99.5 /100 | #55 | Exceptional 85.1% |
| Immigrants | Croatia | 99.5 /100 | #56 | Exceptional 85.1% |
| Chinese | 99.4 /100 | #57 | Exceptional 85.1% |
| Slovaks | 99.4 /100 | #58 | Exceptional 85.1% |
| Serbians | 99.4 /100 | #59 | Exceptional 85.1% |
| Albanians | 99.4 /100 | #60 | Exceptional 85.1% |
| Immigrants | Latvia | 99.3 /100 | #61 | Exceptional 85.0% |
| Immigrants | Moldova | 99.3 /100 | #62 | Exceptional 85.0% |
| Immigrants | Uganda | 99.3 /100 | #63 | Exceptional 85.0% |
| Swedes | 99.2 /100 | #64 | Exceptional 85.0% |