Slavic vs Chinese In Labor Force | Age 35-44
COMPARE
Slavic
Chinese
In Labor Force | Age 35-44
In Labor Force | Age 35-44 Comparison
Slavs
Chinese
84.7%
IN LABOR FORCE | AGE 35-44
90.8/ 100
METRIC RATING
124th/ 347
METRIC RANK
85.1%
IN LABOR FORCE | AGE 35-44
99.4/ 100
METRIC RATING
57th/ 347
METRIC RANK
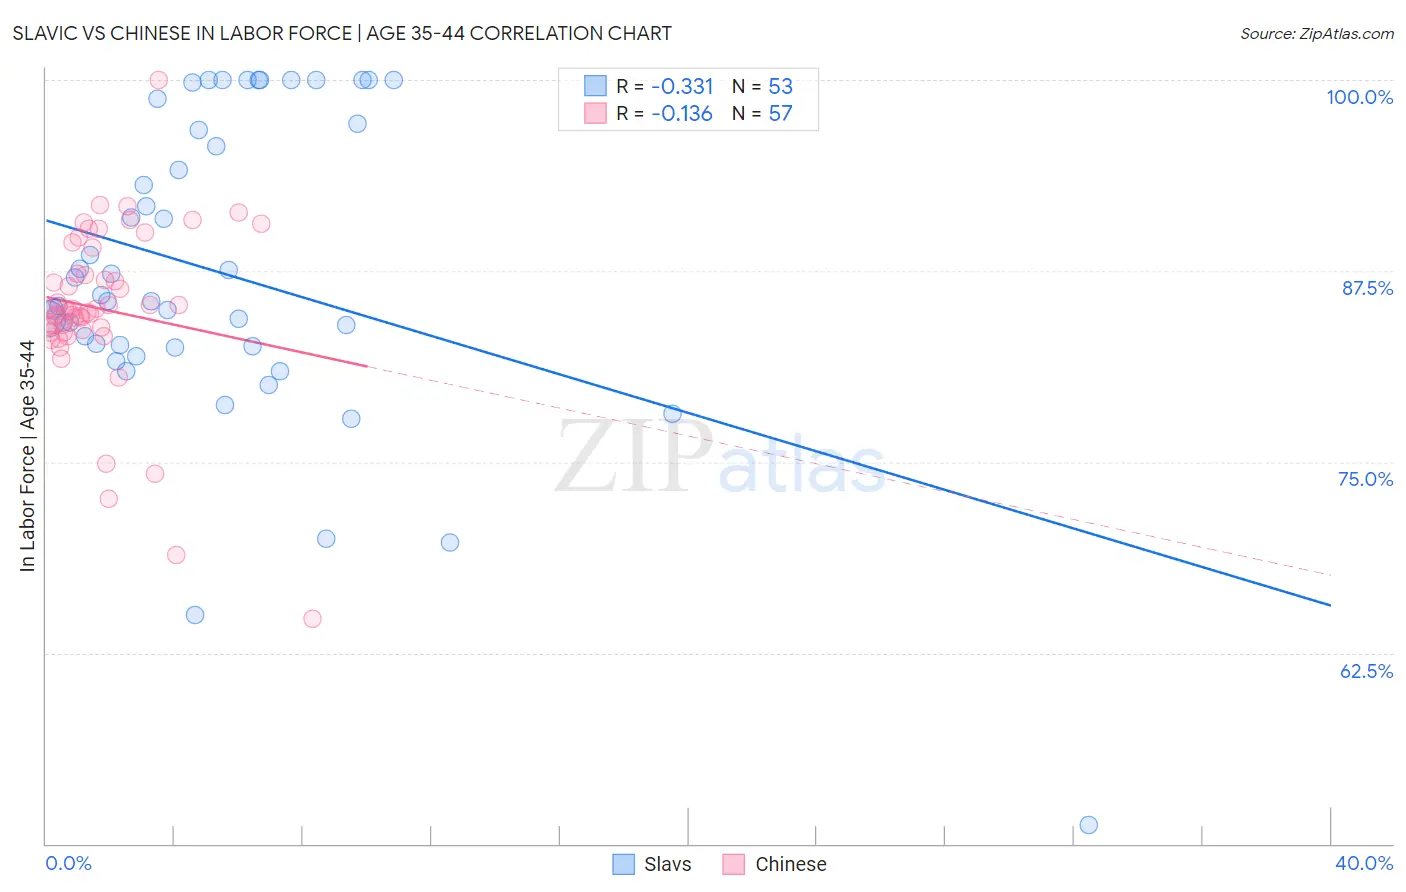
Slavic vs Chinese In Labor Force | Age 35-44 Correlation Chart
The statistical analysis conducted on geographies consisting of 270,832,324 people shows a mild negative correlation between the proportion of Slavs and labor force participation rate among population between the ages 35 and 44 in the United States with a correlation coefficient (R) of -0.331 and weighted average of 84.7%. Similarly, the statistical analysis conducted on geographies consisting of 64,807,570 people shows a poor negative correlation between the proportion of Chinese and labor force participation rate among population between the ages 35 and 44 in the United States with a correlation coefficient (R) of -0.136 and weighted average of 85.1%, a difference of 0.46%.
In Labor Force | Age 35-44 Correlation Summary
| Measurement | Slavic | Chinese |
| Minimum | 51.2% | 64.7% |
| Maximum | 100.0% | 100.0% |
| Range | 48.8% | 35.3% |
| Mean | 87.4% | 85.0% |
| Median | 85.5% | 85.0% |
| Interquartile 25% (IQ1) | 82.5% | 83.6% |
| Interquartile 75% (IQ3) | 96.9% | 88.2% |
| Interquartile Range (IQR) | 14.4% | 4.6% |
| Standard Deviation (Sample) | 10.1% | 5.6% |
| Standard Deviation (Population) | 10.0% | 5.6% |
Similar Demographics by In Labor Force | Age 35-44
Demographics Similar to Slavs by In Labor Force | Age 35-44
In terms of in labor force | age 35-44, the demographic groups most similar to Slavs are German (84.7%, a difference of 0.0%), Immigrants from South America (84.7%, a difference of 0.0%), Maltese (84.7%, a difference of 0.0%), Asian (84.7%, a difference of 0.0%), and Immigrants from Spain (84.7%, a difference of 0.0%).
| Demographics | Rating | Rank | In Labor Force | Age 35-44 |
| Immigrants | China | 92.3 /100 | #117 | Exceptional 84.7% |
| Immigrants | Eastern Asia | 92.1 /100 | #118 | Exceptional 84.7% |
| Burmese | 91.8 /100 | #119 | Exceptional 84.7% |
| Immigrants | Northern Europe | 91.5 /100 | #120 | Exceptional 84.7% |
| Finns | 91.2 /100 | #121 | Exceptional 84.7% |
| Germans | 91.0 /100 | #122 | Exceptional 84.7% |
| Immigrants | South America | 90.9 /100 | #123 | Exceptional 84.7% |
| Slavs | 90.8 /100 | #124 | Exceptional 84.7% |
| Maltese | 90.8 /100 | #125 | Exceptional 84.7% |
| Asians | 90.6 /100 | #126 | Exceptional 84.7% |
| Immigrants | Spain | 90.6 /100 | #127 | Exceptional 84.7% |
| Immigrants | Ghana | 90.4 /100 | #128 | Exceptional 84.7% |
| Palestinians | 89.7 /100 | #129 | Excellent 84.7% |
| Bhutanese | 89.7 /100 | #130 | Excellent 84.7% |
| Immigrants | Scotland | 89.6 /100 | #131 | Excellent 84.7% |
Demographics Similar to Chinese by In Labor Force | Age 35-44
In terms of in labor force | age 35-44, the demographic groups most similar to Chinese are Slovak (85.1%, a difference of 0.010%), Serbian (85.1%, a difference of 0.010%), Albanian (85.1%, a difference of 0.010%), Immigrants from Croatia (85.1%, a difference of 0.020%), and Turkish (85.1%, a difference of 0.030%).
| Demographics | Rating | Rank | In Labor Force | Age 35-44 |
| Thais | 99.7 /100 | #50 | Exceptional 85.2% |
| Immigrants | Albania | 99.7 /100 | #51 | Exceptional 85.1% |
| Immigrants | Kenya | 99.6 /100 | #52 | Exceptional 85.1% |
| Taiwanese | 99.6 /100 | #53 | Exceptional 85.1% |
| Turks | 99.5 /100 | #54 | Exceptional 85.1% |
| Soviet Union | 99.5 /100 | #55 | Exceptional 85.1% |
| Immigrants | Croatia | 99.5 /100 | #56 | Exceptional 85.1% |
| Chinese | 99.4 /100 | #57 | Exceptional 85.1% |
| Slovaks | 99.4 /100 | #58 | Exceptional 85.1% |
| Serbians | 99.4 /100 | #59 | Exceptional 85.1% |
| Albanians | 99.4 /100 | #60 | Exceptional 85.1% |
| Immigrants | Latvia | 99.3 /100 | #61 | Exceptional 85.0% |
| Immigrants | Moldova | 99.3 /100 | #62 | Exceptional 85.0% |
| Immigrants | Uganda | 99.3 /100 | #63 | Exceptional 85.0% |
| Swedes | 99.2 /100 | #64 | Exceptional 85.0% |