Cherokee vs Immigrants from West Indies In Labor Force | Age 20-64
COMPARE
Cherokee
Immigrants from West Indies
In Labor Force | Age 20-64
In Labor Force | Age 20-64 Comparison
Cherokee
Immigrants from West Indies
76.2%
IN LABOR FORCE | AGE 20-64
0.0/ 100
METRIC RATING
317th/ 347
METRIC RANK
78.9%
IN LABOR FORCE | AGE 20-64
1.7/ 100
METRIC RATING
243rd/ 347
METRIC RANK
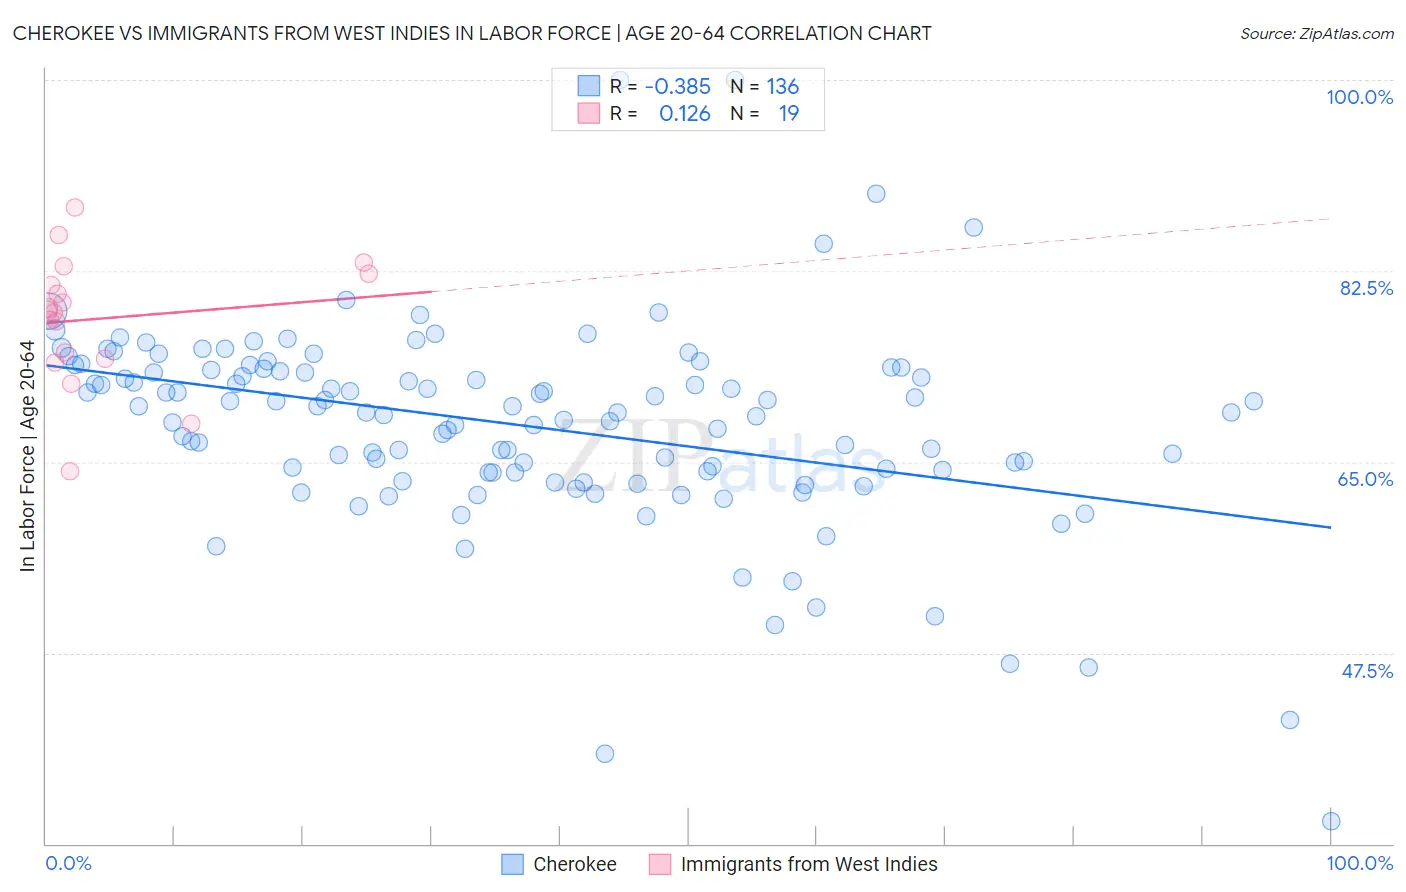
Cherokee vs Immigrants from West Indies In Labor Force | Age 20-64 Correlation Chart
The statistical analysis conducted on geographies consisting of 493,680,494 people shows a mild negative correlation between the proportion of Cherokee and labor force participation rate among population between the ages 20 and 64 in the United States with a correlation coefficient (R) of -0.385 and weighted average of 76.2%. Similarly, the statistical analysis conducted on geographies consisting of 72,456,461 people shows a poor positive correlation between the proportion of Immigrants from West Indies and labor force participation rate among population between the ages 20 and 64 in the United States with a correlation coefficient (R) of 0.126 and weighted average of 78.9%, a difference of 3.5%.
In Labor Force | Age 20-64 Correlation Summary
| Measurement | Cherokee | Immigrants from West Indies |
| Minimum | 32.1% | 64.1% |
| Maximum | 100.0% | 88.3% |
| Range | 67.9% | 24.2% |
| Mean | 68.4% | 78.1% |
| Median | 69.6% | 78.8% |
| Interquartile 25% (IQ1) | 64.0% | 74.5% |
| Interquartile 75% (IQ3) | 73.5% | 82.2% |
| Interquartile Range (IQR) | 9.5% | 7.7% |
| Standard Deviation (Sample) | 9.3% | 5.8% |
| Standard Deviation (Population) | 9.3% | 5.7% |
Similar Demographics by In Labor Force | Age 20-64
Demographics Similar to Cherokee by In Labor Force | Age 20-64
In terms of in labor force | age 20-64, the demographic groups most similar to Cherokee are Chickasaw (76.2%, a difference of 0.040%), Inupiat (76.1%, a difference of 0.21%), Yaqui (76.5%, a difference of 0.40%), Ottawa (76.7%, a difference of 0.59%), and Yakama (75.8%, a difference of 0.59%).
| Demographics | Rating | Rank | In Labor Force | Age 20-64 |
| Comanche | 0.0 /100 | #310 | Tragic 77.0% |
| Blackfeet | 0.0 /100 | #311 | Tragic 77.0% |
| Alaskan Athabascans | 0.0 /100 | #312 | Tragic 76.9% |
| Shoshone | 0.0 /100 | #313 | Tragic 76.8% |
| Blacks/African Americans | 0.0 /100 | #314 | Tragic 76.8% |
| Ottawa | 0.0 /100 | #315 | Tragic 76.7% |
| Yaqui | 0.0 /100 | #316 | Tragic 76.5% |
| Cherokee | 0.0 /100 | #317 | Tragic 76.2% |
| Chickasaw | 0.0 /100 | #318 | Tragic 76.2% |
| Inupiat | 0.0 /100 | #319 | Tragic 76.1% |
| Yakama | 0.0 /100 | #320 | Tragic 75.8% |
| Seminole | 0.0 /100 | #321 | Tragic 75.5% |
| Dutch West Indians | 0.0 /100 | #322 | Tragic 75.5% |
| Cajuns | 0.0 /100 | #323 | Tragic 75.5% |
| Choctaw | 0.0 /100 | #324 | Tragic 75.4% |
Demographics Similar to Immigrants from West Indies by In Labor Force | Age 20-64
In terms of in labor force | age 20-64, the demographic groups most similar to Immigrants from West Indies are Immigrants from Micronesia (78.9%, a difference of 0.020%), Jamaican (78.9%, a difference of 0.030%), French (78.9%, a difference of 0.030%), Trinidadian and Tobagonian (79.0%, a difference of 0.060%), and Welsh (79.0%, a difference of 0.070%).
| Demographics | Rating | Rank | In Labor Force | Age 20-64 |
| Samoans | 2.9 /100 | #236 | Tragic 79.0% |
| Immigrants | North America | 2.9 /100 | #237 | Tragic 79.0% |
| Immigrants | Jamaica | 2.6 /100 | #238 | Tragic 79.0% |
| Welsh | 2.4 /100 | #239 | Tragic 79.0% |
| Trinidadians and Tobagonians | 2.3 /100 | #240 | Tragic 79.0% |
| Jamaicans | 2.0 /100 | #241 | Tragic 78.9% |
| Immigrants | Micronesia | 1.9 /100 | #242 | Tragic 78.9% |
| Immigrants | West Indies | 1.7 /100 | #243 | Tragic 78.9% |
| French | 1.5 /100 | #244 | Tragic 78.9% |
| Scottish | 1.3 /100 | #245 | Tragic 78.9% |
| Immigrants | Trinidad and Tobago | 1.1 /100 | #246 | Tragic 78.8% |
| Immigrants | Germany | 1.0 /100 | #247 | Tragic 78.8% |
| Immigrants | Caribbean | 1.0 /100 | #248 | Tragic 78.8% |
| English | 0.9 /100 | #249 | Tragic 78.8% |
| Hondurans | 0.8 /100 | #250 | Tragic 78.8% |